TPT
Total:
$0.00
Selected
Subjects

Subjects

Arts & Music
English Language Arts
Foreign Language
Holidays/Seasonal
Math
Science
Social Studies - History
Specialty
For All Subject Areas
47 results

Science Common Core 6.SP.A.2 resources
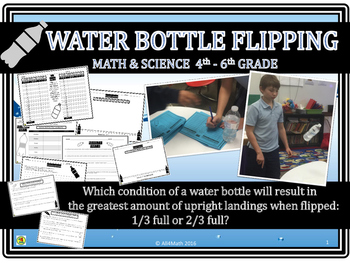
Preview of Water Bottle Flipping Math and Science: 4th - 6th Grade
Water Bottle Flipping Math and Science: 4th - 6th Grade

Created by
All4Math
My 5th & 6th graders FLIP for this math & science lesson! Students gather data using the scientific method to discover if a 1/3 full or 2/3 full water bottle will result in more upright landings. After writing their hypothesis, students flip water bottles 1/3 full and 2/3 full 20 times for each condition. They create class line plots of their data and find the median, mode, and mean of upright landings for both conditions. After analyzing their results, they write their conclusions. An e
Preview of Graphing Lessons and Activities for Charty Party Game
Graphing Lessons and Activities for Charty Party Game

Created by
Teacher Toy Shop
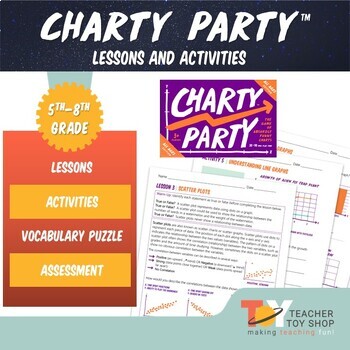
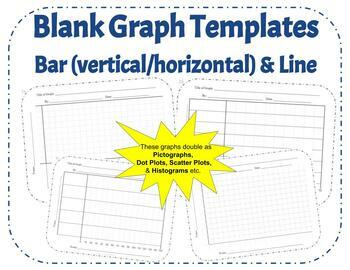
Explore the engaging world of graphing with these Graphing Lessons and Activities for Charty Party Game, featuring nine interactive lessons that seamlessly blend learning with the excitement of a party game. Designed to teach line graphs, bar graphs, scatterplots, and more, these lessons are presented in kid-friendly language, making graphing concepts accessible and enjoyable for students. As they analyze graphs during the Charty Party™ game, students not only practice graphing but also delve in
Preview of 42 Blank Graph Templates: Horizontal & Vertical Bar Graph, Line Graph, Printable
42 Blank Graph Templates: Horizontal & Vertical Bar Graph, Line Graph, Printable

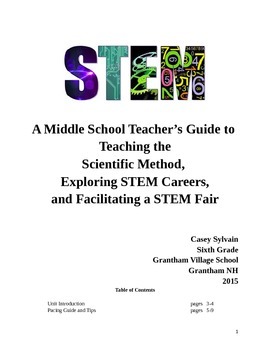
Looking for an array of printable graph templates for all your future bar and line graph needs? Look no further! With 42 different templates ranging for bar graphs, to line graphs, varying in X values and Y values, this combination should be the last graph download you need to worry about for your class. These graphs can even be used as Histograms, Dot Plots, Scatter Plots, or a variety of other graphs to suit the needs of your classroom.I created this template to require all the basics of gr
Preview of Middle School/Upper Elementary Scientific Method and STEM Fair Unit
Middle School/Upper Elementary Scientific Method and STEM Fair Unit

Created by
Casey Sylvain
This unit was designed as a way to incorporate STEM into a more traditional Science Fair model with connections to STEM careers. Students are encouraged to choose a topic that they are deeply interested in and they learn how to connect scientific thinking to concepts outside of science class. They are also introduced to future STEM careers and community resources. The unit is directly aligned to Next Generation Science Standards (NGSS) and the Common Core. In order to help students achieve t
Preview of What's the Verdict: Sharks vs. Lightning? Modes of Center, Spread, and More!
What's the Verdict: Sharks vs. Lightning? Modes of Center, Spread, and More!

Put it to the test! Use the age-old expression: "You are more likely to get struck by lightning than to be bitten by a shark!" to learn and practice Measures of Center, Measures of Spread, Measures of Shape, and Statistical Graphing including:MEANMEDIANMODERANGEOUTLIERS [Using IQR +/- 1.5(IQR)]QUARTILES [lower quartile (IQ-1) and upper quartile (IQ-3)]INTERQUARTILE RANGE (IQR)MEAN ABSOLUTE DEVIATION/ M.A.D. ft. ABSOLUTE VALUESYMMETRY/ASYMMETRY OF DISTRIBUTIONCLUSTERS AND GAPSBELL SHAPED CURVE AN
Preview of Skittle Radiometric Decay Half-life Lab
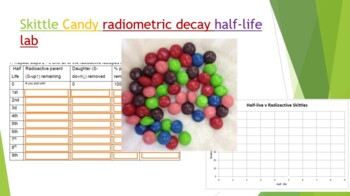
Skittle Radiometric Decay Half-life Lab

Created by
3D-PT
Did you know you can use Skittles candy to demonstrate absolute dating and radiometric decay! Buy a 1-4 lb bag at your local bulk warehouse store for savings. This lab is a great way to show how isotopes decay by shaking a plate full of random skittles. Students use Skittles to observe "Isotopes" decay over each half life. At the end of the lab (and only IF they have done all their work) they can enjoy their "daughter products". Skittles were used because they are durable, hypoallergenic, and th
Preview of WWII Airplane Fighter Gliders - GATE STEM + Reading 3rd-7th Grades
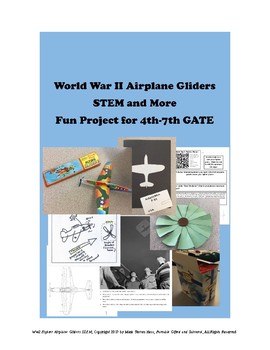
WWII Airplane Fighter Gliders - GATE STEM + Reading 3rd-7th Grades

Yes, we get to throw little gliders around the classroom. This is the sneakiest, most evil sort of teacher trick: learning standards and being challenged academically while having fun! This unit is perfect for a Friday or the day before a vacation. Start it in the morning, and run across the entire curriculum throughout the school day. Or take pieces out of the unit here and there over the course of days and weeks . . . as the components can work as “stand alone” or as a cohesive trip acr
Preview of Greece Geography 6th Grade Statistics Box Plot Histogram Mean Median Activity
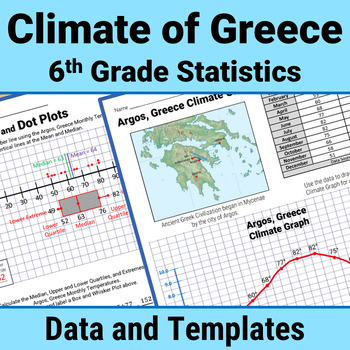
Greece Geography 6th Grade Statistics Box Plot Histogram Mean Median Activity

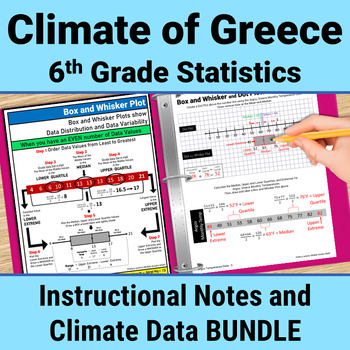
Enrich your study of Ancient Greece using 6th Grade stats skills to analyze Greek climate data. Calculate Measures of Central Tendency (mean, median, mode, range) and Mean Absolute Deviation. Master Data Display with Box and Whisker Plots, Histograms, Dot Plots, Stem and Leaf Charts. Write Statistical Questions. Analyze Data Distribution and Data Variability.All with climate data (temperature and precipitation) from Greece!This Print and Go STEM/STEAM PBL resource includes 70+ pages of climate d
Preview of Halloween Stations: Tables and Graphs
Halloween Stations: Tables and Graphs

Created by
DrBScience
Empower your students to brush up on their study skills while celebrating Halloween. Students will work through four stations: Tables, Line Graphs, Bar Graphs, and Pie Graphs. Each station will review the concept, have students analyze a table or graph to draw a conclusion about the data, and then create their own table or graph based on the data provided. After completing the stations, the teacher can present the slides in Canva to review the answers. Links are provided as Canva template links.
Preview of Paper Plane STEM Activity using Engineering Design Process & Analyzing Means
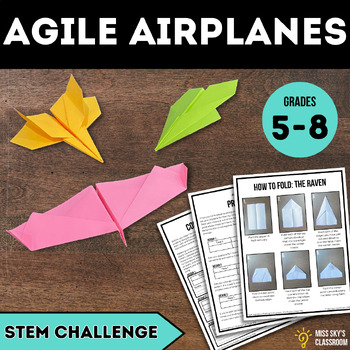
Paper Plane STEM Activity using Engineering Design Process & Analyzing Means

This paper plane STEM challenge is an excellent engineering activity for middle school students to practice using the engineering design process. Students will engage in hands-on, project-based learning that enables them to make real world connections. As a teacher, you will love the low prep activity and detailed teacher guide including differentiation ideas and suggested responses. In this 90 minute STEM Activity, students will work in groups to test and analyze existing paper plane designs be
Preview of China Geography 6th Grade Statistics Box Plot Histogram Mean Median Activity
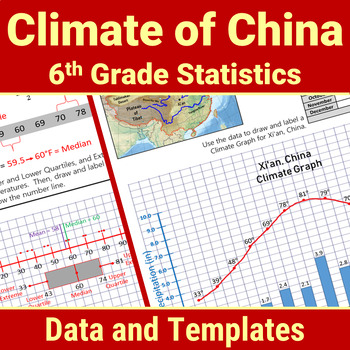
China Geography 6th Grade Statistics Box Plot Histogram Mean Median Activity

Enrich your study of Ancient China using 6th Grade statistics and Probability skills to analyze China climate data. Calculate Measures of Central Tendency (mean, median, mode, range) and Mean Absolute Deviation. Master Data Display with Box and Whisker Plots, Histograms, Dot Plots, Stem and Leaf Charts. Write Statistical Questions. Analyze Data Distribution and Data Variability.All with climate data (temperature and precipitation) from China!This Print and Go STEM/STEAM PBL resource includes 70
Preview of Statistical Questions Mini-Lesson with In-Class Project
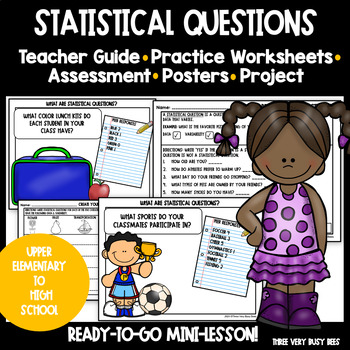
Statistical Questions Mini-Lesson with In-Class Project

Statistical QuestionsUse this mini-lesson to teach your students the difference between a statistical question and a regular question.Students will know statistical questions have:datavariabilityThis resource is a mini-lesson designed to be completed in one week; however, you can take as much or as little time as you like!What’s included:✅Teacher Guide & Example Poster✅3 Posters with Statistical Questions and Images ✅What Are Statistical Questions worksheet✅Find the Variability & Data wo
Preview of Exploring Tides. Graphing Data and Patterns Project
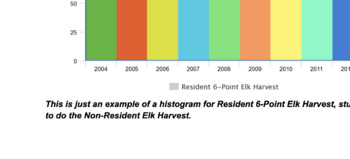
Exploring Tides. Graphing Data and Patterns Project

This activity helps students to see the connection between the moon phases and the height of Tides. In this activity students are required to graph the height of the highest tides and the lowest tides of each day given. Then they compare that with the calendar for the new and full moons. The patterns help them discover the relationship between moon phases and tides. Excellent reinforcer of graphing skills with a science connection.
Preview of Amplify Science/Math Natural Selection: Elk Histograms and Data Interpretation
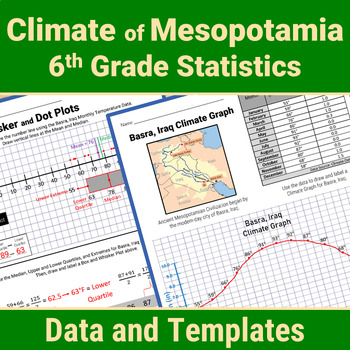
Amplify Science/Math Natural Selection: Elk Histograms and Data Interpretation

Created by
Michael Thomas
This worksheet will work well for students who are part-way through the Natural Selection Unit of Amplify, or students who need some practice interpreting data and representing it in histograms or bar graphs. This would also work well for a day where you had a sub. Students will be asked to find answers to questions by looking at data as well as determine if there are any patterns in the data. They will also realize that different forms of data representation lends itself to finding patterns mo
Preview of Mesopotamia Geography 6th Grade Statistics Box Plot Mean Median Mode Activity
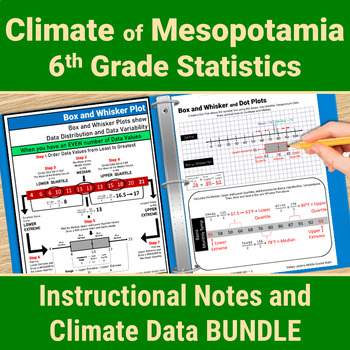
Mesopotamia Geography 6th Grade Statistics Box Plot Mean Median Mode Activity

Enrich your study of Mesopotamia using 6th Grade stats skills to analyze Mesopotamian climate data. Calculate Measures of Central Tendency (mean, median, mode, range) and Mean Absolute Deviation. Master Data Display with Box and Whisker Plots, Histograms, Dot Plots, Stem and Leaf Charts. Write Statistical Questions. Analyze Data Distribution and Data Variability.All with climate data (temperature and precipitation) from Iraq and Turkey!This Print and Go STEM/STEAM resource includes 70+ pages of
Preview of Mesopotamia Geography 6th Grade Statistics Mean Median Mode Box Plot Activity
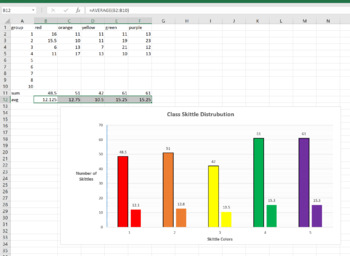
Mesopotamia Geography 6th Grade Statistics Mean Median Mode Box Plot Activity

Enrich your study of Mesopotamia using 6th Grade stats skills to analyze Mesopotamian climate data. Master Data Display with Box and Whisker Plots, Histograms, Dot Plots, Stem and Leaf Charts. Calculate Measures of Central Tendency (mean, median, mode, range) and Mean Absolute Deviation. Write Statistical Questions. Analyze Data Distribution and Data Variability.All with climate data (temperature and precipitation) from Iraq and Turkey!This Print and Go STEM/STEAM PBL resource includes 120 pages
Preview of Skittle Statistics MS Excel Mini-Lab

Skittle Statistics MS Excel Mini-Lab

Created by
3D-PT
This is a 1 class MS Excel lab for a computer or math class. You can have the students explore the distribution of different color Skittles in class. This is a great mini-lab or half-day activity when you school ends up with a weird schedule day. Tell them they can't eat till the Skittles till the end of class, or they will distort their numbers. Also make sure they don't throw them or shove them up their nose (Yes, stuck Skittles are hard to extract, ask me how I know..)The goal of this lab is
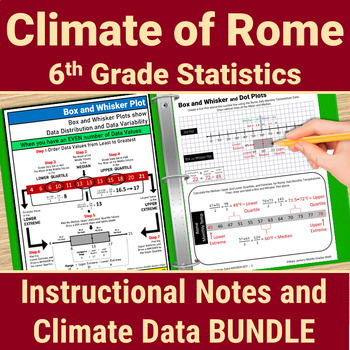
Preview of Rome Geography 6th Grade Statistics Box Plot Histogram Mean Median Mode Activity
Rome Geography 6th Grade Statistics Box Plot Histogram Mean Median Mode Activity

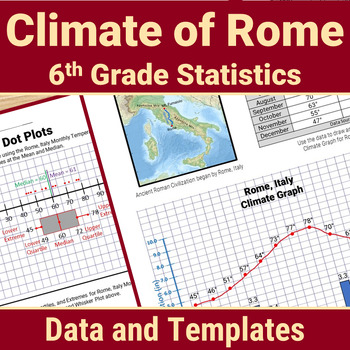
Enrich your study of Ancient Rome using 6th Grade stats skills to analyze Italy climate data. Calculate Measures of Central Tendency (mean, median, mode, range) and Mean Absolute Deviation. Master Data Display with Box and Whisker Plots, Histograms, Dot Plots, Stem and Leaf Charts. Write Statistical Questions. Analyze Data Distribution and Data Variability.All with climate data (temperature and precipitation) from Rome!This Print and Go STEM/STEAM PBL resource includes 70+ pages of climate data
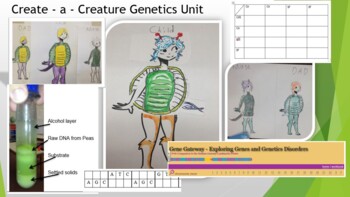
Preview of Create - a - Creature Genetics Unit

Create - a - Creature Genetics Unit

Created by
3D-PT
This whole unit covers the basics of genetics! It includes the Create a Creature lab, home genetic test, Punnet Squares, webquest, and final test!You can also extract DNA from dried peas; practice reading DNA and RNA; explore genetic disorders through the Human Genome Project webquest; and explore pedigree charts! You will have to create your own shell and tail pieces this. The original artist has gone on to draw a Google doodle ! You can also have the students design their own shell / tails. Th
Preview of Best Ever Bird Beak Lesson

Best Ever Bird Beak Lesson

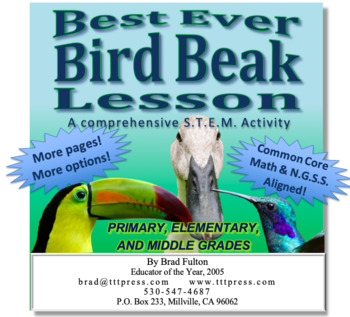
Students will enjoy participating in this engaging exploration that helps them understand the diversity of the animal kingdom and the concept of adaptation. They will mimic the feeding habits of birds with various types of beaks to learn how species have adapted to their environments. Options allow the lesson to be extended through the grade levels from primary to middle school and into math, technology, and engineering for a full S.T.E.M. experience.
Preview of Greece Geography 6th Grade Statistics Mean Median Mode Range Box Plot Activity
Greece Geography 6th Grade Statistics Mean Median Mode Range Box Plot Activity

Enrich your study of Ancient Greece using 6th Grade statistics skills to analyze Greek climate data. Master Data Display with Box and Whisker Plots, Histograms, Dot Plots, Stem and Leaf Charts. Calculate Measures of Central Tendency (mean, median, mode, range) and Mean Absolute Deviation. Write Statistical Questions. Analyze Data Distribution and Data Variability.All with climate data (temperature and precipitation) from Greece!This Print and Go STEM/STEAM PBL resource includes 120 pages of Inst
Preview of Rome Geography 6th Grade Statistics Mean Median Mode Box Plot Histogram Activity
Rome Geography 6th Grade Statistics Mean Median Mode Box Plot Histogram Activity

Enrich your study of Ancient Rome using 6th Grade Statistics and Probability skills to analyze Italy climate data. Master Data Display with Box and Whisker Plots, Histograms, Dot Plots, Stem and Leaf Charts. Calculate Measures of Central Tendency (mean, median, mode, range) and Mean Absolute Deviation. Write Statistical Questions. Analyze Data Distribution and Data Variability.All with climate data (temperature and precipitation) from Rome!This Print and Go STEM/STEAM PBL resource includes 120 p
Preview of Vacation Planning PowerPoint (No Prep, Print & Go)
Vacation Planning PowerPoint (No Prep, Print & Go)

Created by
BJamirson
This project lets students research the process of planning a vacation. They use actual websites (hotels.com, enterprise, and google flights) that we would to plan one. They budget their vacation. Also, research the weather and cuisine on their vacation. Afterward, have them create a presentation from their findings. You will get the powerpoint so you can edit it.
Preview of 6 Editable Bar Graph Templates 2.0

6 Editable Bar Graph Templates 2.0

Finally a simple and professional graph space that students can fill out without any design issues getting in the way. This file contains 6 ready-to-use graph options. Print them and have students fill them with pencil and ruler, or distribute them over computer and let them practice entering the data. Get a project perfect finish every time. Maybe you just want to fill it out live on a projector? The possibilities are endless! It's okay to say you love these bar graphs. So do we.Contains:- 2 bl
Showing 1-24 of 47 results

Find Science resources | TPT

Importance of learning science

Learning science is particularly important for students as it equips them with the essential knowledge and skills to make sense of the world around them. Science education is not just about memorizing facts. It fosters critical thinking, inquiry, and problem-solving abilities. These skills are not only useful in school but also in everyday life beyond the classroom.

Benefits of learning science

Learning science offers many benefits to students both in school and beyond. In fact, it helps students:

  • Question the world around them and seek evidence-based explanations
  • Cultivate their ability to observe, experiment, and analyze data
  • Nurture a sense of curiosity, awe, and wonder about the natural world
  • Understand natural phenomena and the laws that govern the universe

With a solid foundation in science, teachers can help empower students to think critically, solve problems, make informed decisions, and engage with the world around them in meaningful ways.

Teaching with science resources

One of the best parts about science class is all of the possibilities for hands-on, collaborative learning! Think: labs, experiments, inquiry-based activities, and design challenges. These activities encourage students to explore scientific concepts by observing, asking questions, and conducting investigations. Additionally, with small group centers, students can engage in group experiments, discussions, and projects that require them to collaborate, share ideas, and solve problems together.

Discover printable and digital science resources

If you’re a teacher or parent looking for printable or digital science resources, TPT has an extensive array of instructional materials for every learning need, topic, or grade level. Whether you're learning about plant parts or butterfly life cycles, or exploring advanced topics like the anatomy of a cell or Newton’s laws of motion, we've got you covered.

On TPT, science resources come in various forms: from labs and worksheets to craftivities and doodle notes. They can be used to enhance learning, assess a student’s mastery of science concepts, or to reteach a tricky topic. With plenty of TPT resources at your fingertips, teaching and learning science will be so much easier. Plus, you can expand students’ knowledge even further by exploring TPT math resources, which are frequently paired with science lessons.

Frequently asked questions about teaching science

What types of science lessons are available on TPT?

There are many different types of science resources sold by Sellers on TPT. Some popular science lessons include biology, earth sciences, chemistry, environment, engineering, and anatomy.

How do I find science lessons on TPT?

Educators can save time preparing science lessons with resources created by experienced teachers. Simply start a search for science resources on the TPT marketplace, and filter by grade level, price, and/or resource type to find materials that've been proven to work in classrooms like yours. No matter what you’re teaching, there are plenty of science lessons and activities sold by Sellers on TPT that are tailored to meet your students' skill levels.

How can I make my science lessons fun and engaging?

Students learn best when they're engaged! Sprinkle a little fun into your science lessons and make them feel like real scientists by investigating everyday objects, exploring the world outside the classroom, and doing hands-on and collaborative experiments and design challenges.