767 results
10th grade statistics internet activities for homeschool
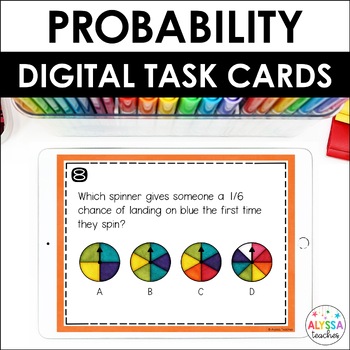
Probability Task Cards (Digital)
Probability is one of my favorite math topics to teach! These digital probability task cards make a great review activity for math centers, warmups, early finishers, and more. You can use this set during your probability unit or save it for an end-of-year test review.To complete the task cards, students move objects on the screen and type answers to questions. They'll complete everything directly in Google Slides. No prep for you; no lost papers for them!Students will:use probability vocabulary
Subjects:
Grades:
4th - 5th
Types:
CCSS:
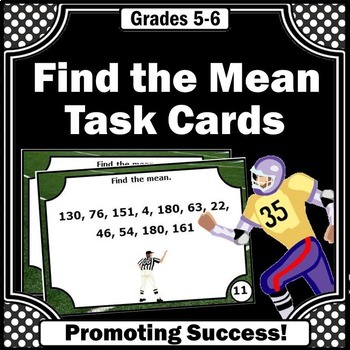
Probability and Statistics Activities Find the Mean Average of Data Task Cards
You will download 30 math task cards for your 5th and 6th grade students to practice and review finding the mean task. They work well with your measures of central tendency unit. A mean in math is the average of a data set, found by adding all numbers together and then dividing the sum of the numbers by the number of numbers.For your convenience, you will download both TPT digital EASEL and printable PDF resource formats. ☛ Please click on the PREVIEW above.You may use the printable task cards i
Subjects:
Grades:
5th - 6th
Types:
CCSS:
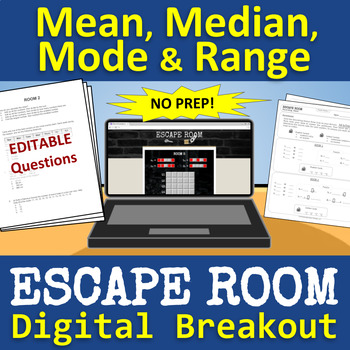
Mean, Median, Mode & Range ESCAPE ROOM - Digital Breakout | Distance Learning
Students will have a blast trying to break out of this escape room! There are 5 digital rooms with fun puzzles that engage students and challenge their problem-solving skills while they practice math content (mean, median, mode and range). Great for team-building! Quick and easy setup. Includes 100% digital option! CLASSROOM SETUP:Print/copy the math questions for each group.Print/copy the recording sheet for each student.Provide a device for each group (the Escape Room link is on the recording
Subjects:
Grades:
6th - 8th
Also included in: Math Escape Room - Digital Breakout - BUNDLE
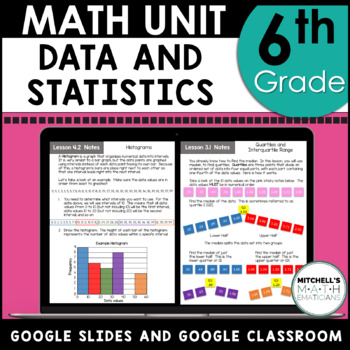
6th Grade Math Data and Statistics Curriculum Unit 7 Using Google
In this NO PREP Google Drive product you get an entire unit that covers: statistical questions; categorical and numerical data; frequency tables; line plots; dot plots; mean, median, mode, and range; outliers; quartiles and interquartile range (IQR); mean absolute deviation (MAD); bar graphs; histograms; box-and-whiskers plots; and much more . All you have to do is share the file with your students and they can get started. Text boxes are included so your students know where to type their answer
Subjects:
Grades:
6th - 7th
Types:
Also included in: 6th Grade Math Curriculum Bundle CCSS Aligned
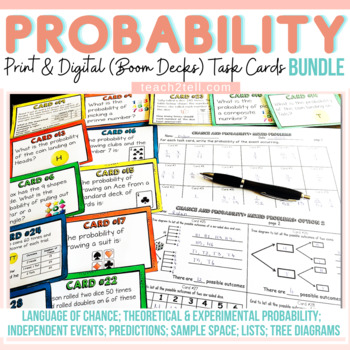
Theoretical Probability Activities Print Digital Task Cards Boom Cards Bundle
Are you teaching your students all about Theoretical Probability and looking for fun hands-on Chance and Probability activities? This print and digital (Boom Decks) bundle of 192 probability task cards will reinforce the understanding of theoretical probability, experimental probability, language of chance, sample space, predictions, lists, tree diagrams and independent probability events.Please see the preview file for more information.Both US and British English spelling and terminology includ
Subjects:
Grades:
4th - 8th
Types:
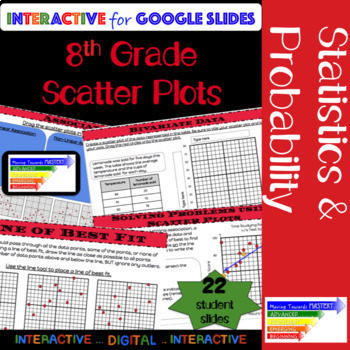
8th Grade Math Scatter Plot: Guided Interactive Lesson
Extensive ALL digital guided lesson for constructing and interpreting scatter plots.The slides are scaffolded to build understanding. Students will progress from identification of terms to making predictions involving bivariate data. The guided slides will begin with identification, move towards assisted analysis, and conclude with independent practice.Slides include...♦ Definitions and Visual Representations♦ Identification and Use of Terms→ Bivariate Data→ Scatter Plot→ Linear, Nonlinear, &
Subjects:
Grades:
8th - 10th
Types:
CCSS:
Also included in: 8th Grade Math Common Core Growing Bundle
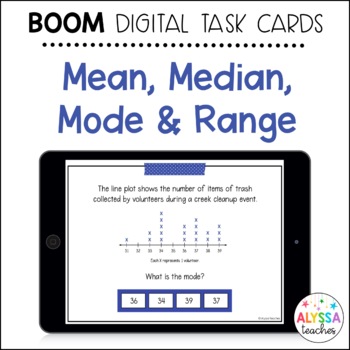
Mean, Median, Mode, and Range Boom Cards
Engage your students with data analysis skills with these digital task cards! Students can use this interactive activity to describe and determine the mean, median, mode, and range of a set of data. This is perfect for math stations, early finisher options, morning work, and assessment during your data unit, for spiral review, or for test prep.The 20 self-checking task cards are hosted on Boom Learning℠ and are completely online - no printing, cutting, or laminating! Students will complete the B
Subjects:
Grades:
4th - 6th
Types:
Also included in: 5th Grade Math SOL Boom Cards Bundle
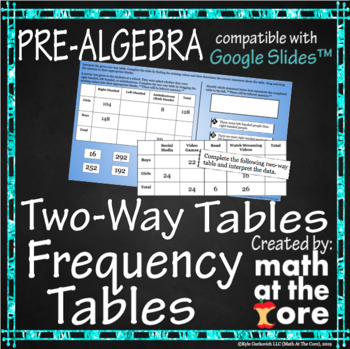
Two-Way Tables - Frequency Tables for Google Slides™
- Great for online and distance learning! Created to be compatible with Google Slides™!- In this digital activity, students will construct and interpret two-way frequency tables.- This activity includes 31 different problems involving two-way frequency tables. Students will start with determining which statements about a given frequency table are true and which are false. They will then have to analyze the table and fill in the missing blanks to make the table correct and complete. The problems
Subjects:
Grades:
7th - 8th
Types:
CCSS:
Also included in: Statistics - Unit 7 - BUNDLE for Google Slides™
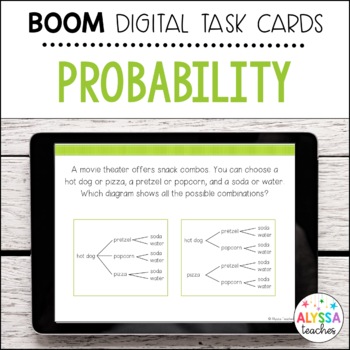
Probability Boom Cards (Sample Space and Counting Principle)
Teaching probability? These interactive, paperless task cards are a fun and rigorous way for students to review determining the probability of an outcome by using sample spaces and the Fundamental Counting Principle. This activity works well for centers, early finishers, review, morning work, and assessment.The 16 self-checking task cards are hosted on Boom Learning℠ and are completely online - no printing, cutting, or laminating! Students will complete the cards by clicking on answer choices -
Subjects:
Grades:
5th - 6th
Types:
Also included in: 5th Grade Math SOL Boom Cards Bundle
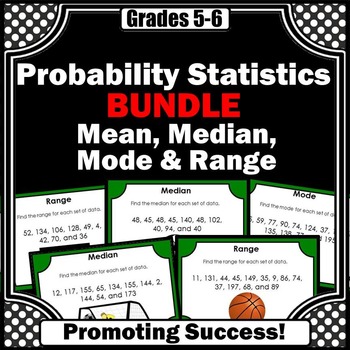
Mean Median Mode Range Task Cards BUNDLE Measures of Central Tendency Games
DIGITAL PDF AND PRINTABLE PACKET: In this bundle, you will download 120 (4 sets) mean, median, mode and range task cards for your 6th grade, 7th grade, and special education math students to practice measures of central tendency. You may use the printable task cards in math centers or stations for fun practice and review games and activities, such as a scavenger hunt or SCOOT. They also work well for transition activities, as exit tickets, for morning work, and as quick formative assessments. G
Subjects:
Grades:
5th - 7th
CCSS:
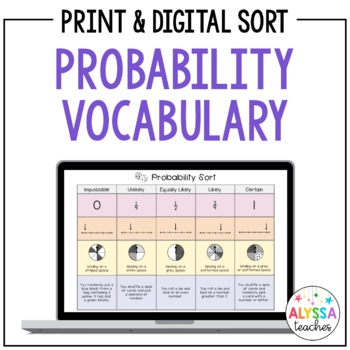
Probability Sorting Activity | Digital and Print
I love using hands-on sorting activities in math to keep students engaged! These probability sorting cards are a great way to have students practice representing probability as well as identifying the likelihood of an event occurring. This works well as a pre-assessment, classwork/homework assignment, review, or post-assessment. This resource includes a hands-on printable version as well as a digital version in Google Slides™. Use in your classroom or for distance learning! Since there are a lot
Subjects:
Grades:
3rd - 5th
Types:
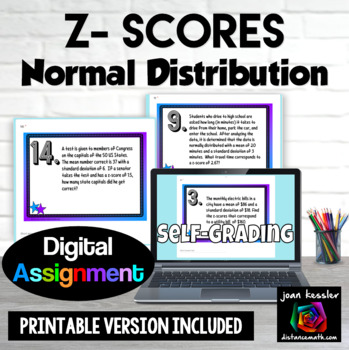
Normal Distribution Z-Scores Digital plus Print
Your students will get extra practice and gain fluency learning about z-scores and the Normal Distribution with both a self-grading digital resource and a PDF printable version. There are 16 applications to solve with a mix of multiple choice and free response including: finding the z-scorefinding the standard deviation knowing the z-score, mean, and data point finding the mean knowing the z-score, data point, and standard deviationinterpreting the z-score. Your download includes:PDF with link
Subjects:
Grades:
9th - 12th
Types:
CCSS:
Also included in: Probability and Statistics Algebra 2 Unit 11 Activity Bundle

Measures of Center and Spread |Mean, Median, Standard Deviation, +|Google Forms™
Included in this Product: 100% Self-Grading Assessment or Homework using Google Forms™ - Measures of Center and Spread - Mean, Median, Range, Interquartile Range, Standard Deviation - 26 Questions each (9 multiple choice, 15 free response, and 2 checkbox). The default multiple choice answer order is generally set to be "shuffled" to prevent cheating. However, this can be edited. 2 similar versions for the price of 1!! Having a second version of the form allows for retakes and also gives you opt
Subjects:
Grades:
8th - 12th
Types:
CCSS:
Also included in: Algebra 2 Google Forms™
TEK 8.5D Making Predictions on Scatter Plots for Google Classroom™ & Boom Cards™
Are you looking for a fun activity that covers Math TEK 8.5D which is flexible enough to be a hit with your students whether you are in the classroom or teaching remotely? If that sounds like something you'd be interested in, you are going to fall in love with our super-flexible digital & printable combination task card sets. These making predictions on scatter plots digital activities are one-click away from being loaded as (1) self-graded Google Forms, (2) Google Slides, (3) Boom Cards,
Subjects:
Grades:
7th - 8th
Types:
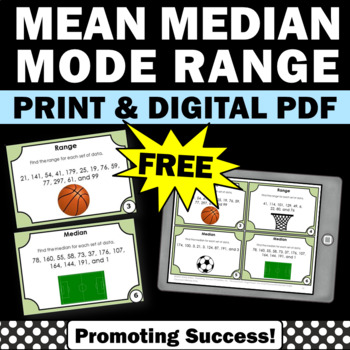
FREE Statistics and Probability Mean Median Mode Range Task Cards 5th 6th Grade
DIGITAL PDF AND PRINTABLES: You will download six free mean, median, mode and range task cards for your 5th or 6th grade students to practice finding the mean, median, mode and range. You may use the printable task cards in math centers or stations for fun review games and activities, such as a scavenger hunt or SCOOT. They also work well for transition activities, as exit tickets and for morning work, quick formative assessments. Game ideas, a student response form and answer key are included.✔
Subjects:
Grades:
5th - 6th
Types:
CCSS:
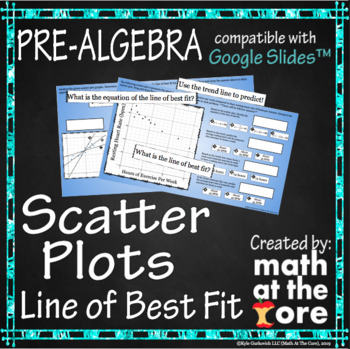
Scatter Plots - Line of Best Fit for Google Slides™
- Great for online and distance learning! Created to be compatible with Google Slides™!- In this digital activity, students will analyze scatter plots and determine the line of best fit. They will use the line of best fit and the equation of that line to predict values. They should be familiar with writing the equation of a line.- This activity includes 20 different problems involving analyzing scatter plots. Students will start with determining which line is the line of best fit for the given s
Subjects:
Grades:
7th - 9th
Types:
Also included in: Statistics - Unit 7 - BUNDLE for Google Slides™
TEK 7.6I Theoretical & Experimental Probability Google Classroom™ & Boom Cards™
Are you looking for a fun activity that covers Math TEK 7.6I which is flexible enough to be a hit with your students whether you are in the classroom or teaching remotely? If that sounds like something you'd be interested in, you are going to fall in love with our super-flexible digital & printable combination task card sets. These theoretical and experimental probability digital activities are one-click away from being loaded as (1) self-graded Google Forms™, (2) Google Slides™, (3) Boom
Subjects:
Grades:
6th - 7th
Types:
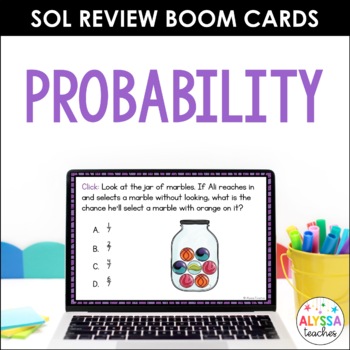
Math SOL Review Boom Cards | Probability (SOL 4.13)
Want to provide your students rigorous math review while engaging them with technology? This interactive digital task card set is a helpful way for students to review probability. This is a great addition to math stations, early finisher options, and morning work during your probability unit.SAVE 20% with the 4th grade Math SOL Review Boom Cards BUNDLE!The 10 self-checking task cards are hosted on Boom Learning℠ and are completely online - no printing, cutting, or laminating! You will need a Boo
Subjects:
Grades:
4th
Types:
Also included in: 4th Grade Math SOL Review Boom Cards Bundle
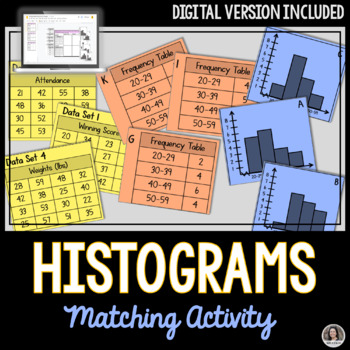
Histograms Matching Activity, Print and Digital Google Slides™
Practice makes perfect! This matching histograms activity is an ideal assignment for students to demonstrate their understanding of Histograms. Students match the data set to their corresponding frequency tables and histogram graphs. There will be 6 matches made when complete. Included:A pdf with a link to make a copy of the Interactive Google Slides™ for your own Google Drive™A printable version for students to sort and match.Student Response SheetAnswer keyDigital Version:Go paperless with thi
Subjects:
Grades:
7th - 12th
Types:
Probability & Statistics ★ Math TEK 7.6A 7.6C 7.6D 7.6E 7.6F 7.6G 7.6H & 7.6I
Are you looking for a unit's worth of engaging printable & digital activities that cover the 7.6 TEKS Math Domain (Probabilistic and Statistical Proportionality)* while being immediately implementable in printable and digital formats? If that sounds like something you might be interested in, I'm confident this product is going to meet and exceed your expectations!*Currently Math TEK 7.6B is not included in this bundle as it is not part of the assessed curriculum and is a very difficult stand
Subjects:
Grades:
7th - 8th
Types:
Distance Learning | Statistics: Mean, Median, Mode, Range Digital Lesson
This Digital Google Slides Mean, Median, Mode, and Range lesson is a full 3-part lesson. This product includes notes, student practice, and an exit ticket. This is aligned to 6th grade Common Core Standards and hits on ONE part of 6.SP.B.5C, finding the mean and median of data sets to analyze quantitive measures of center. Mode and Range are added spiral review in this lesson as they relate closely with mean and median.About This Product:-1 cover/title slide-1 notes slide with examples, vocabul
Subjects:
Grades:
6th
Types:
CCSS:
Also included in: 6th Grade Math Statistics Bundle | CCSS Aligned
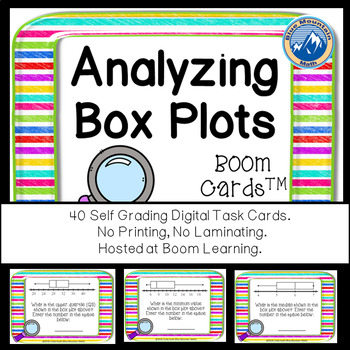
Analyzing Box Plots Boom Cards--Digital Task Cards
Boom Cards™ are a great way for students to practice skills analyzing Box Plots--formerly called Box and Whisker Plots. You can assess their understanding and students can play again to keep improving. This set uses a variety of different plots and asks question about lower quartile, upper quartile, median, interquartile range, range and outliers. This set of Boom Cards features 40 different Digital Self-Checking Task Cards. (No printing, cutting, laminating, or grading!)
Boom Cards live in the
Subjects:
Grades:
7th - 10th
Types:
CCSS:
Also included in: Algebra 1 Bundle Boom Cards--Digital Task Cards Distance Learning
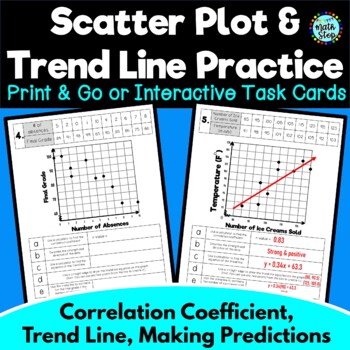
Scatter Plot Trend Line of Best Fit Correlation Coefficient Practice Task Cards
Students are given five different scatter plot scenarios (for example, temperature and the number of ice creams sold) with a table and graph already created. Their job is to use a calculator to find the correlation coefficient and equation of the line of best fit. Then for each one, they are asked to:➤ State the correlation coefficient/r-value.➤ Describe the strength and direction of the scatter plot.➤ Find the equation of the line of best fit/trend line.➤ Draw the line of best fit on the scatte
Subjects:
Grades:
7th - 10th
Types:
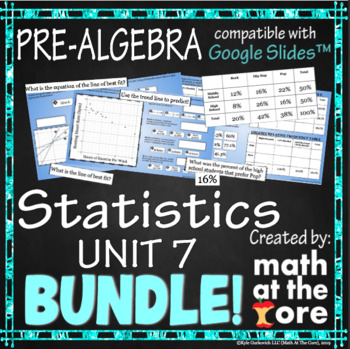
Statistics - Unit 7 - BUNDLE for Google Slides™
- Great for online and distance learning! Created to be compatible with Google Slides™!-In this interactive unit, students will interpret scatter plots. They should be able to determine what type of correlation a situation has whether it is by graph or through words. They should be able to identify clusters and outliers. students will analyze scatter plots and determine the line of best fit. They will use the line of best fit and the equation of that line to predict values. They should also be a
Subjects:
Grades:
7th - 8th
Types:
Showing 1-24 of 767 results


