62 results
5th grade statistics lectures for Gifted and Talented
Statistics Unit
Fun with Box and Whiskers, Mean, Median, Mode, Range, Five Number Summary using anything from McDonald's food to M&M's with SKittles.

Bundle Public Speaking for Young Kids-No Prep- Digital and Print- Editable
⭐️Bundle for Public Speaking for Young Kids.⭐️Public Speaking for young kids is an engaging activity that will help your students gain confidence in speaking in public and the ability to write memorable speeches.⭐️Research shows that kids who speak confidently perform better in class. Through public speaking, children learn various skills like presentation skills, communication skills, critical thinking skills, and listening skills, that enable them to present ideas with much clarity and convict
Grades:
1st - 5th
Types:

Spy: Secret Lives of Spies. Cause, Effect, and Problem Solving
Students learn about the relationship between cause, effect, and problem-solving while exploring the secret lives of spies. Who knew? Spies have problems too!Why Spy?Pocket Litter, Bang and Burn, Chicken Feed, Cobbler, Dead drop. Could you speak like a spy? Could you live like a spy? Students love exploring the world of secret agents and the roles they play in protecting their countries. Espionage was born out of a need to solve problems. Those problems might include acquiring enemy secre
Grades:
5th - 8th
Types:
Also included in: Codes, Lives of Spies, and a Spy Simulation! Spy Bundle #4

Ecology Interdependence of Life Power Point
This Power Point appeals to the visual learner. The black background and neon colors assist in the retention of information. Topics cover biotic/abiotic factors, food chains/webs and Symbiosis.
Subjects:
Grades:
5th - 8th
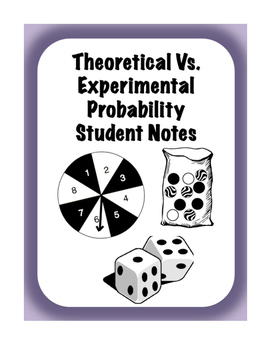
Theoretical vs Experimental Probability Interactive Scaffolded/Guided Notes
These notes provide a clear explanation of theoretical and experimental probability with examples involving spinners, die, and marbles. Students will also get extra practice converting their probabilities to decimals, fractions, and percents along with predicting the probability of an event happening.
There is also a flipped classroom video that goes along with these notes that can be accessed at-
https://youtu.be/FAHvmiYJA1A
Subjects:
Grades:
5th - 8th

Changing the Face of Math Education Book 2
Whether you are a teacher, a parent, a student, strong in math or weak in math, the material in this book will change the way you view and compute math in the future. Be ready to be amazed and intrigued as you go through the book by all the information you probably were never exposed to in your math education. This book will answer many questions you may have had in the past while giving you a much stronger conceptual understanding of math. This book will expose you to many different problem-sol
Subjects:
Grades:
4th - 12th
Types:
Statistics (Mean, Median, Mode, Box and Whiskers, with the five number summary
Teaching statistics to 6th graders can be an engaging experience by making the concepts relatable and visual. Five-Number SummaryThe five-number summary includes the minimum, first quartile, median, third quartile, and maximum. These values help summarize a set of data and are used in creating box plots. Start by having students collect a small dataset, such as their test scores, and calculate these five points to see how data is distributed.Box and Whisker PlotsA box and whisker plot (box plot)
Subjects:
Grades:
5th - 7th
Types:
Also included in: Statistics Unit
Data Representation Powerpoint
The presentation contains: 1) TALLY MARKS Learning Objectives. Definition of a tally mark. Uses of tally mark. How to count a tally mark. Tally Mark Chart. Construction of a tally mark table with an example. Application on real life problems on tally mark. Read and Interpret a tally mark table.The presentation contains: 2) FREQUENCY DISTRIBUTION TABLEDefinition of a Frequency Distribution Table. Types of Frequency Distribution Table: a) Discrete Frequency Distribution Table (Ungrouped).b) C
Subjects:
Grades:
1st - 10th, Higher Education, Staff

Bonding with Friends: H2O & Helium (Two Rhyming STEM Nonfiction Stories, NGSS)
A perfect STEM book for kids in the classroom or at home! This covers reading, science, and poetry in one lesson that will keep students entertained while learning whether they are physically at school or remotely. This rhyming picture book has two stories in one! "Bonding with Friends: H2O & Helium" has a story about the water molecule and another story about helium. NGSS and Common Core standards identified. Virtual author reading with activity available too, visit www.STEMistryBooks.com.T
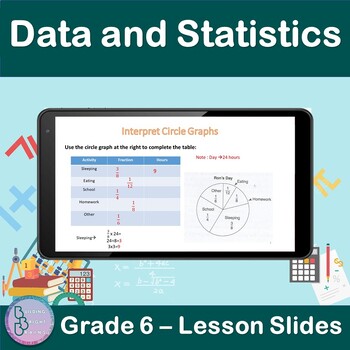
Data and Statistics | 6th Grade PowerPoint Lesson Slides | Circle Graphs
Are you teaching your students about Data and Statistics For 6th Grade? Plenty of examples and application exercises are included. You can also easily convert this to a Google Slides lesson by dragging it into your Google Drive.What is included?✦ 9 total slides for notes, examples and applications.✦ All steps are animated to allow the teacher to explain them gradually. At the end of the lesson, students will be able to✦ Interpret Circle Graphs.✦ Use a circle graph to complete s table.✦ Use a cir
Subjects:
Grades:
5th - 7th
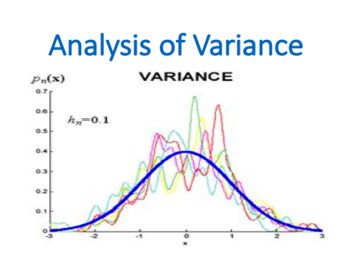
Analysis of Variance (ANOVA) (Statistics)
Analysis of Variance (ANOVA) is a lecture which is covered within the Statistic or Basic Business Statistic module by business and economics students.Analysis of variance, known by the acronym ANOVA, allows statistical comparison among samples taken from many populations. While ANOVA literally does analyze variation, the purpose of ANOVA is to reach conclusions about possible differences among the means of each group, analogous to the hypothesis tests of the previous chapter. Every ANOVA design
Subjects:
Grades:
5th - 12th, Higher Education, Adult Education, Staff
Types:
Also included in: Statistics Module Bundle
A Roadmap for Analyzing Data (Statistics)
A Roadmap for Analyzing Data is a lecture which is covered within the Statistic or Basic Business Statistic module by business and economics students. Choosing appropriate statistical methods for your data is the single most important task you face and is at the heart of “doing statistics.” But this selection process is also the single most difficult thing you do when applying statistics! How, then, can you ensure that you have made an appropriate choice? By asking a series of questions, you can
Subjects:
Grades:
5th - 12th, Higher Education, Adult Education, Staff
Also included in: Statistics Module Bundle
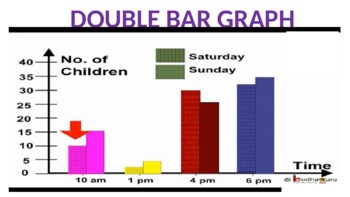
Double Bar Graph Powerpoint
The presentation contains:Learning Objectives.Definition of a double bar graph.Parts of a double bar graph.Difference between bar graph and double bar graph.Tips for construction of double bar graph.Steps to construct double bar graph with an example.To read and interpret the double bar graph.
Subjects:
Grades:
5th - 10th, Staff
Also included in: Data Representation Powerpoint

Unlocking Potential: Strategies for Supporting Twice Exceptional (2E) Students
Welcome to the presentation on Unlocking Potential: Strategies for Supporting Twice Exceptional 2E Students . This session will explore effective strategies for nurturing the unique talents of twice exceptional learners.
Grades:
PreK - 12th
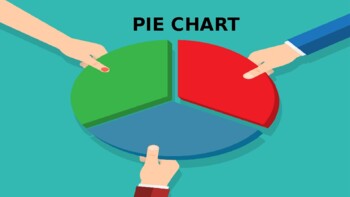
Pie Chart Powerpoint
The presentation contains:Learning Objectives.Definition of a Pie Chart.Tips for construction of pie chart.Steps to construct a pie chart with an example.Scaling and drawing a pie chart.Read and Interpret a pie chart.
Subjects:
Grades:
5th - 10th, Staff
Also included in: Data Representation Powerpoint
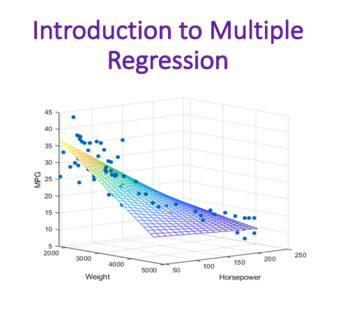
Introduction to Multiple Regression (Statistics)
Introduction to Multiple Regression is a lecture which is covered within the Statistic or Basic Business Statistic module by business and economics students.This lecture will introduce you to multiple regression models that use two or more independent variables to predict the value of a dependent variable. Learning objectives: · How to develop a multiple regression model· How to interpret the regression coefficients· How to determine which independent variables to include in the regression mode
Subjects:
Grades:
5th - 12th, Higher Education, Adult Education, Staff
Types:
Also included in: Statistics Module Bundle
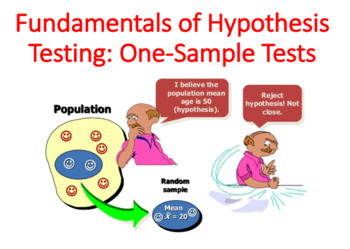
Fundamentals of Hypothesis Testing: One-Sample Tests
Fundamentals of Hypothesis Testing: One-Sample Tests is a lecture which is covered within the Statistic or Basic Business Statistic module by business and economics students. In this lecture, you will learn several applications of hypothesis testing. You will learn how to make inferences about a population parameter by analyzing differences between the results observed, the sample statistic, and many more. Learning objectives: The basic principles of hypothesis testingHow to use hypothesis testi
Subjects:
Grades:
5th - 12th, Higher Education, Adult Education, Staff
Types:
Also included in: Statistics Module Bundle
Basic Probability (Statistics)
Basic Probability is a lecture which is covered within the Statistic or Basic Business Statistic module by business and economics students.The principles of probability help bridge the worlds of descriptive statistics and inferentialstatistics. Probability principles are the foundation for the probability distribution, the concept of mathematical expectation, and the binomial, Poisson, and hypergeometric distributions, topics. In this lecture you learn to: Basic probability conceptsAbout conditi
Subjects:
Grades:
5th - 12th, Higher Education, Adult Education, Staff
Types:
Also included in: Statistics Module Bundle
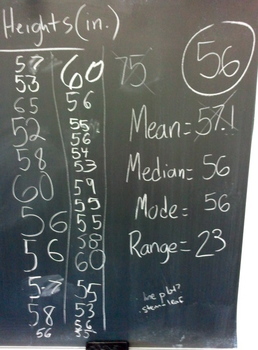
Introduction to Statistics (Focus on Mean, Median, Mode, & Range)
I use this PowerPoint presentation to introduce (or in some cases review) our statistics unit. It starts off with a warm-up where students measure each other to capture some class data on height. Then the slides go through key vocabulary words, like mean, median, mode, range, outlier, data set, and cluster. Each of those slides provides a definition that students can take notes from and an example. At the end of the presentation, students are encouraged to apply these statistical measures to
Subjects:
Grades:
3rd - 6th
CCSS:
Line Graph Powerpoint
The presentation contains:Learning objectives.Definition of a line graph.Parts of a line graph.Tips for construction of line graph.Steps to construct line graph with an example.Reading and Interpreting a line graph.Advantage of line graph.
Subjects:
Grades:
5th - 10th, Staff
Also included in: Data Representation Powerpoint
Understanding Learning Styles: Making a Difference for Diverse Learners (eBook)
Students have different learning styles! Understanding Learning Styles helps teachers determine the learning style of each student and the appropriate delivery methods to target and address the needs of as many of the intelligences as possible. Different learning-styles are presented in this professional book that helps teachers determine how best to teach their students. Surveys, practical ideas, and suggestions for designing lessons that incorporate multiple learning styles are provided to sho
Grades:
K - 12th
Types:
Time-Series Forecasting (Statistics)
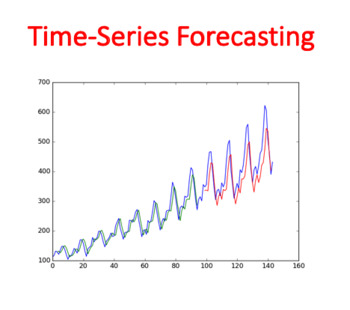
Time-Series Forecasting is a lecture which is covered within the Statistic or Basic Business Statistic module by business and economics students. A time series is a set of numerical data collected over time. Due to differences in the features of data for various investments described in the Using Statistics scenario, you need to consider several different approaches for forecasting time-series data. This lecture begins with an introduction to the importance of business forecasting and a descript
Subjects:
Grades:
5th - 12th, Higher Education, Adult Education, Staff
Also included in: Statistics Module Bundle
Numerical Descriptive Measures (Statistics)
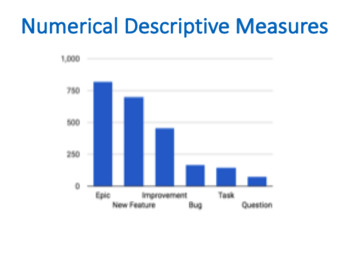
Numerical Descriptive Measures is a lecture which is covered within the Statistic or Basic Business Statistic module by business and economics students. Central tendency is the extent to which the values of a numerical variable group around a typical, or central, value. Variation measures the amount of dispersion, or scattering, away from a central value that the values of a numerical variable show. The shape of a variable is the pattern of the distribution of values from the lowest value to the
Subjects:
Grades:
5th - 12th, Higher Education, Adult Education, Staff
Types:
Also included in: Statistics Module Bundle
Defining and Collecting Data (Business Statistics)
Defining and Collecting Data is a lecture which is covered within the Statistic or Basic Business Statistic module by business and economics students.Nowadays, Data playing an important role in the success of the company. Without reliable and proper data most probably company will fail, while by possessing good data company may get a competitive advantage over main competitors in the market. It is extremely important for future managers to understand how to collect as well as to analyze data, as
Subjects:
Grades:
5th - 12th, Higher Education, Adult Education, Staff
Types:
Also included in: Statistics Module Bundle
Showing 1-24 of 62 results


