6 results
Graphing resources for Microsoft Word and for GATE

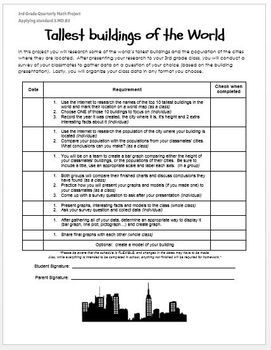
Data and Graphing Enrichment Project - Tallest Buildings
This product is a great project to enhance your students' understanding of the Data and Graphing standards for grade 3. This project is wonderful for your gifted students who have already showed mastery of CCSS MD.B3 and need something to take their learning to the next level.
This multi-faceted project includes research, data analysis, note-taking, bar graph creation, speaking skills (I have students present their buildings to the class), surveys and plotting survey results. I also have an o
Subjects:
Grades:
3rd
Types:
CCSS:

Zach's Eraser: Linear Functions and Line of Fit
This is an effective and thought-provoking way to helps students apply functions to real situations. The resulting function shows a negative slope. Though it is a simple linear function, the data is not perfect, so a line of fit must be employed. Because it is based on real data, even students who have only a beginning experience with functions can understand the concepts and mathematics. The lesson can incorporate slope-intercept and point-slope forms as well as independent and dependent variab
Subjects:
Grades:
7th - 10th
Types:

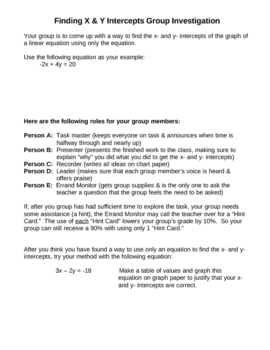
X and Y Intercepts Group Investigation
Students work together in a self discovery to figure out how to find the X and Y intercepts of a line just by using the linear equation. Students may ask for the provided hint cards if they are having difficulty. However, hint cards lower the group's grade. 2 pages
Grades:
7th - 11th
Types:

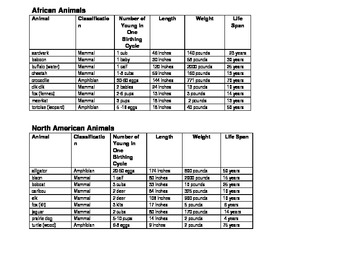
Common Core Math Project: African vs. North American Animals Comparison
Common Core Math real world application problem. In this project, your students have just gotten a great summer job as an Intern at the Columbus Zoo. Their first assignment is to help the research department put together a series of graphs to compare data about North American and African animals. This project provides all of the data and instructions for students to meet the Common Core standards under Representing and Interpreting Data related to graphing. It also integrates the ELA concep
Subjects:
Grades:
2nd - 4th
Types:

4MDB4- Data Informercials
Students will use line plots with fractional scales along with other types of graphs (differentiated based on MAPs range) to create an infomercial which supports an opinion.
Subjects:
Grades:
4th - 5th
Types:

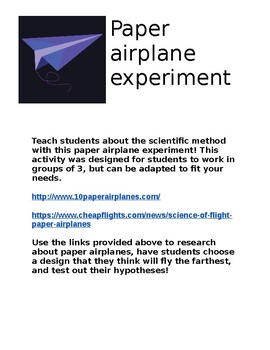
Paper Airplane Experiment
Teach your students about the scientific method with this experiment about paper airplanes! This activity involves research, hands-on learning, and graphing.
Subjects:
Grades:
3rd - 5th
Types:
Showing 1-6 of 6 results


