15 results
Graphing resources for GATE $5-10
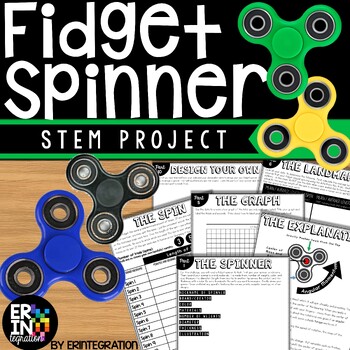
Fidget Spinner STEM Challenge Activities and Science Experiment
The ORIGINAL Fidget Spinner Stem Challenge & Science Lab! Discover the science of fidget spinners with this engaging and low-prep STEM activity. Practice scientific method with an exploration of variables, data collection, graphing, mean/average, and more...all while having fun!This self-paced, fidget spinner activity is print-and-go. Each activity sheet guides students through the project. STEM Challenge Overview:Students will use the included visual directions, graphic organizers, chart
Subjects:
Grades:
3rd - 6th
Types:
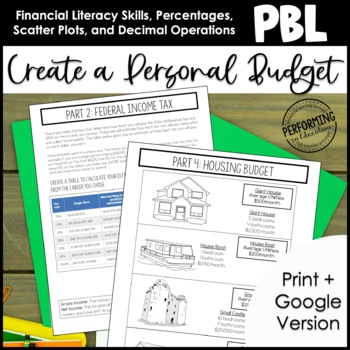
Project Based Learning: Create a Personal Budget 6th Grade Math
Project based learning for 6th grade math skills is awesome! Teach your students math skills and financial literacy through this project-based learning activity. Your students will practice decimal operations (money), work with percentages, and create scatter plots. Challenge activities allow for it to be used in 6th grade as well. It includes a teacher guide walking you through each step.Your students will get their first peek at the process of creating a budget! Kids love having choices, and t
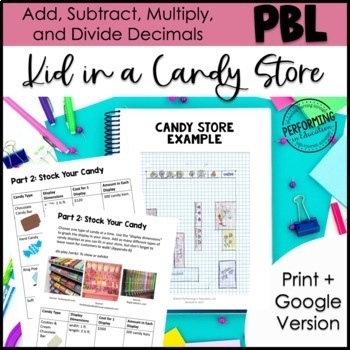
Add, Subtract, Multiply Decimals Project Based Learning | Valentine's Day
Looking for an exciting and engaging way to teach your 5th graders about adding, subtracting, and multiplying decimals? Look no further than our "Adding, Subtracting, Multiplying Decimals Project Based Learning for 5th" math project! This is a great PBL for Valentine's Day or any other day of the year with the engaging candy shop theme.This week-long math project is designed to help students develop a deep understanding of these key mathematical concepts through hands-on activities that challeng
Subjects:
Grades:
4th - 6th
Also included in: 5th Project Based Learning Math Starter Kit Bundle
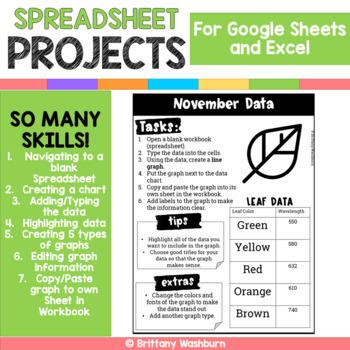
Google Sheets and Excel Spreadsheet Projects {12 Months}
12 projects with monthly themed data for students to practice creating spreadsheets in Google Sheets or Excel. There are 2 optional rubrics included too if you want to make this an assessment tool.SO MANY SKILLS!1. Navigating to a blank Spreadsheet2. Creating a chart3. Adding/Typing the data4. Highlighting data5. Creating 5 types of graphs6.Editing graph information7.Copy/Paste graph to own Sheet in Workbook1 for each month of the year (I stayed away from religious holidays)Works for any spreads
Grades:
2nd - 5th
Run A Business Project Based Learning
This is a Project Based Learning activity that teaches students about running their very own business! It focuses on collaborative opportunities through hands-on experiences for students to engage in their learning. Students will create a business plan and follow through by running their business. Project Based Learning: Run A BusinessThis product includes differentiated activities, math skills, reading, research, writing, vocabulary, problem solving, aligned with Common Core, and extension acti
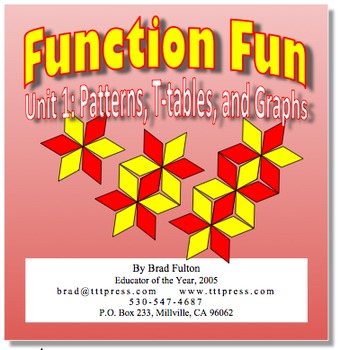
Function Fun, Unit 1: Patterns, T-tables, and Graphs
OVER 50 PAGES! These are the best strategies for teaching linear functions to all students. Tested in grades 4 through high school, this unit helps students develop competency with both the concepts and computations involved in functions. The multi-representational activities cover slope, y-intercept, t-tables, graphs, formulas, and visual representations of linear functions.This unit is part 1 of a four-part series and includes 17 patterns in both color and black and white versions to provide t
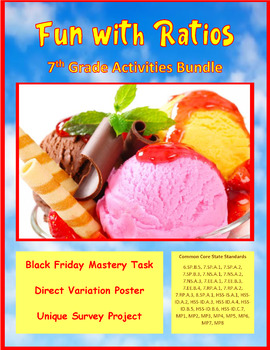
Fun with Ratios Activities Bundle - 7th Grade PBL with Math
The purpose of the Fun with Ratios Activities Bundle is to give students the opportunity to use creativity to apply ratios, proportions, and percentages in real-world settings. This bundle includes three unique tasks: Black Friday Mastery Task, Direct Variation Poster Mastery Task, and the Unique Survey Project. These activities and their accompanying materials are suited for students in grades 7 through 9. These lessons make excellent sub plans. Each project takes approximately two 60-minute bl
Subjects:
Grades:
7th - 9th
Types:

A Pirate's Life - Treasure Hunt Challenge
Unleash your inner pirate with this map-making treasure hunt challenge. Students will make a treasure map using graphing and map-making skills, as well as, draft a secret message to help other pirate's locate the buried treasure. This activity is highly engaging, and can be used to reinforce a variety of classroom topics, including but not limited to: graphing, geography, European Exploration, navigation, early coding, Florida history, Golden Age of Piracy, homeschool education, enrichment, a
Subjects:
Grades:
2nd - 6th
Types:
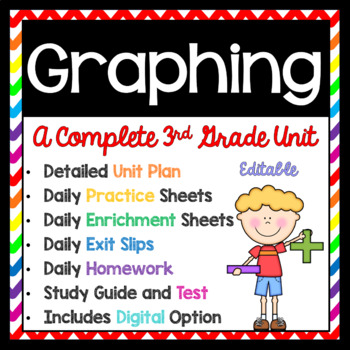
3rd Grade Graphing Unit - 3rd Grade Math
This 3rd grade math graphing unit has what you need to deliver a seamless unit. Everything is integrated so that each daily lesson is specifically aligned to that day's practice sheet, enrichment sheet, exit slip(s), and homework.This unit is either 7 or 11 days long (depending on if you cover line plots or not) and the order can be moved around if you desire since it is editable. Everything included also has a Google version.Out of everything included, I am most excited about the enrichment she
Grades:
3rd
Types:
Also included in: 3rd Grade Math Curriculum for the Entire Year
Graphing Our Class Time Capsule Project
Infuse authentic learning into your math classroom by having your students complete this PBL to represent their class in graphs. The project is organized around the central question: How can we tell people in the future about our class using graphs to be placed in a time capsule? Students will examine historical graphs then come up with important ideas about their class to represent in graph form. Once they come up with a plan, they will conduct surveys and create a variety of graphs. Throughout
Grades:
3rd - 6th
Data and Graphing - 20 Challenge NO PREP Printables
Find the 2nd Grade NO PREP Challenge Math Bundle here!Find Data Collection and Graphing activities here!Find Data and Graphing Exit Tickets here!These 20 no prep challenge printables are perfect for classrooms studying data collection, data analysis, and graphing! Just hit print! Students will be able to...-use Venn diagrams (2 and 3 circle)-use bar graphs-use line plots-use pie charts-use tally marks-use pictographs (picture graphs both representing single and multiple items)-collect, show, a
Data Project
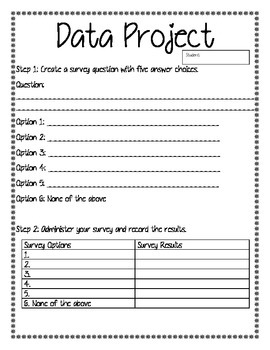
Students create their own survey question and choices. After administering the survey, students use the data to create a line plot, bar graph, and pie chart. Then, they write a detailed summary of their data.
Graphing and Data Math Journal BUNDLE
These bundled math journals include journals for graphing categorical and numeric data including bar graphs, line graphs, stem and leaf plots, mean, median, mode, and range. The journal pages cover the standards for 4th and 5th grade math in VA. Each math journal includes printable pages where students can think critically and analyze data represented in a variety of ways. The journals are great for independent, partner, or small group math center work. They can also easily be used for homework.
Subjects:
Grades:
3rd - 5th
Types:
CCSS:
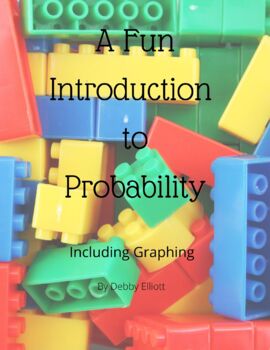
A Fun Introduction to Probability
This product contains fourteen pages that introduce probability by graphing the LEGOs and comparing the number of studs on LEGO bricks. These statistics will be figured in fractions, decimals and percentages. Graphing will be done on bar graphs and pie graphs. The worksheets are colorful and engaging for students. Students will learn to find the mean, median and mode of different numbers of studs on LEGO bricks. Students will find their own statistics and combine them with the statistics of ot
Subjects:
Grades:
4th - 9th
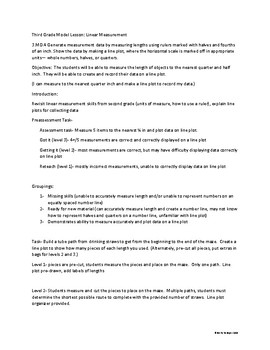
Tiered Lesson: Linear Measurement and Line Plots
Great hands on, problem based math lesson! This tiered lesson provides differentiated learning activities for students at three different levels of readiness- excellent for reaching learners at all different levels of ability. Students utilize measurement and problem solving skills to create solutions to mazes and display their solutions using line plots. Includes pre and post assessments, three levels of mazes, and lesson instructions. Levels 2 and 3 enrich and extend learning. Smart boar
Subjects:
Grades:
2nd - 4th
Showing 1-15 of 15 results


