22 results
Adult education statistics resources for Microsoft Excel and for early intervention
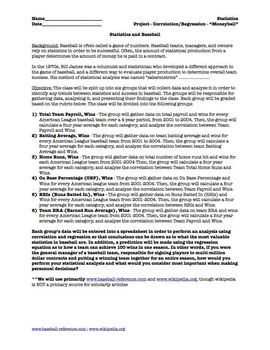
Statistics Correlation and Regression Project for Movie "Moneyball" (5 day)
Prerequisite: Correlation and Regression (Linear). This is a project that divides a statistics class into 6 groups and students do ACTUAL data collection from given websites and they perform their OWN ANALYSIS. They will use computers/internet/excel/spreadsheets/graphing calculators to evaluate correlation. If you have interest in baseball and statistics, this is a great project to get the class interested, and covers about 5 days, plus you can watch the movie "Moneyball" afterwards as a reward.
Subjects:
Grades:
10th - 12th, Higher Education, Adult Education
Types:

IEP Time Data Sheet -SPED / AUTISM Tool- Track Wanted/Unwanted Behaviors
EDITABLE, BEAUTIFUL, and EASY TO USE over and over for IEP's, Special Education, and/or classroom data tracking. You enter the time data and the rest is done for you automatically. Simply record the amount of time a student spends on wanted or unwanted behaviors and the sheet will then automatically: total percentages and create a graph.This Data Collection Tool works great for tracking any behavior related to time. For example a student with autism interacting at recess; how much time any child
Grades:
PreK - 12th, Adult Education
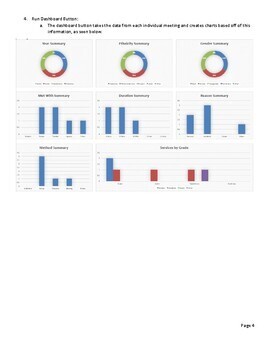
School Counselor Data Tracker- ASCA model!
Now with fully editable categories and headings! (Adjust grade levels, reason for visit, method of visit, etc).This is a program, created in excel, that tracks school counselor's meeting data and produces an easy to read excel doc as well as a dashboard of statistics.See the user guide (preview file) of how the program works and all that it does. Tracks visits with student, teacher, parent etc and services in the ASCA model. Compatible with Windows & IOS!Note: When updating the settings, can
Grades:
PreK - 12th, Higher Education, Adult Education, Staff
Business Analytics 2nd Edition Sanjiv Jaggia, Alison_SOLUTIONS MANUAL
SOLUTIONS MANUAL for Business Analytics, Communicating with Numbers 2nd Edition by Sanjiv Jaggia Professor, Alison Kelly Professor The download file inludes:Complete Chapters 1-18Compressed zip folder INSTRUCTOR MANUAL ALL CHAPTERSR Code GuidePython Guide and SolutionsExcel Spreadsheets and WorkBookSyllabus Undergrad Business AnalyticsSylabus Business Analytics and Data Mining for BusinessAppendix
Subjects:
Grades:
Higher Education, Adult Education, Staff
Types:
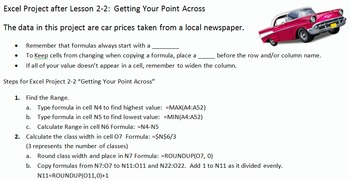
Excel Projects for Statistics Frequency Distributions and Charts
This file contains three different projects with solutions and a quick reference card for students. It correlates to Bluman's Elementary Statistics textbook.
First is an Introduction to Excel. There is an example, guided practice and then 4 Projects. The instructions are on each sheet. The topics covered are: basic editing and formatting, beginning charts, beginning formulas, such as SUM and AVERAGE, and calculations. There is an editable grading rubric for this project. The Preview file
Subjects:
Grades:
8th - 11th, Higher Education, Adult Education
Types:
Student Supports Data Tracker - RTI Academic & Behavioral
THIS IS A SIMPLIFIED & USEFUL TRACKER TO MAINSTREAM ALL OF YOUR STUDENT DATA.THIS DATA TRACKER WILL KEEP TRACK OF ALL YOUR INTERVENTIONS, PARENT COMMUNICATIONS, ABC OF BEHAVIOR DATA, FOLLOW UP, SUPPORTS ( ACADEMIC, SOCIAL-EMOTIONAL, BEHAVIORAL, MTSS, SAP, RSP, IEP REFERRALS), ALL ACTIONABLE ITEMS, ETC. THIS TRACKER FILTERS & SORTS DATA FOR YOU! YOU CAN BE AS DETAILED OR AS ABRIDGED AS NECESSARY.THIS DATA TRACKER IS BOTH A SIMPLIFIED AND EFFICIENT WAY OF COVERING YOURSELF WHEN A PARENT E
Grades:
PreK - 12th, Adult Education, Staff
Types:
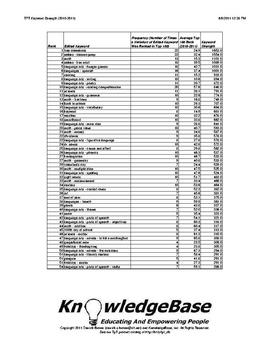
TPT KeyWord Strength Index (2010-2011) - Downloadable Spreadsheet!
What are the strongest keywords on TpT?
1. free downloads
2. Deanna Jump
3. math
Neither #1 nor #2 are surprises, but #3 (math) was certainly a surprise to me!
This report analyzes TpT's 2010-2011 keywords using a measure called "keyword strength".
The measure is based on a keyword's average rank, as well as the number of times it appeared in the 2010-2011 "Top 100" TpT search engine rankings.
This can be a valuable tool to help sellers understand TpT's marketplace supply and demand!
The P
Subjects:
Grades:
PreK - 12th, Higher Education, Adult Education, Staff
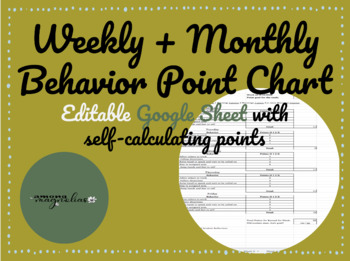
Weekly + Monthly Behavior Point Chart - Google Sheet
This weekly + monthly behavior point chart is used to manage problem behavior. It is editable so you can change the goals as needed. At the beginning of the week, the student thinks of their point goal for the week and it is written/typed at the top. If the student makes his/her goal, reward! If not, they have points (data) to reflect on and strive to beat. The points add to the total as you enter them so it saves you time!This can be used as a Tier I and Tier II behavior intervention. CI/CO (Ch
Grades:
PreK - 12th, Higher Education, Adult Education
Types:
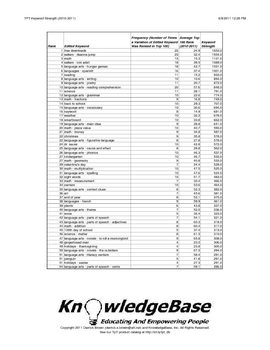
TPT KeyWord Strength Index (2010-2011) - Downloadable PDF!
What are the strongest keywords on TpT?
1. free downloads
2. Deanna Jump
3. math
Neither #1 nor #2 are surprises, but #3 (math) was certainly a surprise to me!
This report analyzes TpT's 2010-2011 keywords using a measure called "keyword strength".
The measure is based on a keyword's average rank, as well as the number of times it appeared in the 2010-2011 "Top 100" TpT search engine rankings.
This can be a valuable tool to help sellers understand TpT's marketplace supply and demand!
The P
Subjects:
Grades:
PreK - 12th, Higher Education, Adult Education, Staff
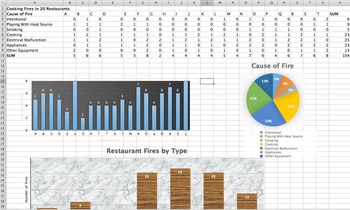
Statistics Project Unit 3 Spreadsheets Mean Median Mode Std. Deviation (2 day)
This is a 1-2 day project aimed at introducing a statistics class to Excel (or Numbers) who are familiar with Pie Charts, Bar Charts, Measures of Central Tendency, and Standard Deviation. The students will input data (included) into Excel (on fires in restaurants), form their own Bar Charts and Pie Charts, and be able to input formulas into the Excel to automatically calculate statistics. Students will be given the opportunity to explore different charts and design their charts to make them colo
Subjects:
Grades:
9th - 12th, Higher Education, Adult Education
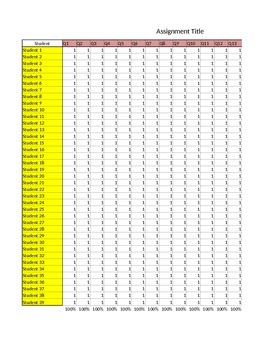
In Depth Test Data Sheet/Pre - Post test graph
This Excel Spread helps you analyze a test so you can reteach in the most needed areas. It also will let you compare pre and post tests to each other and has a pre made graph that will display your data. Great for parent teachers, interventions, directing instruction, or just gathering your own data.
CLICK PREVIEW to watch a video that explains the spreadsheet.
If you like this please follow us or share with your friends.
Grades:
PreK - 12th, Higher Education, Adult Education, Staff
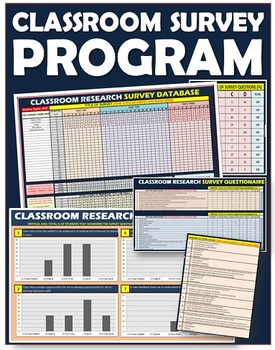
Surveys: Classroom All-IN-ONE Research Program
Empower Your Teaching with Data: Enhance Your Classroom with Powerful Survey Analysis!Elevate your teaching practice by leveraging the power of data with this user-friendly survey analysis program.Here's what sets it apart:Effortless Data Visualization: Transform survey responses into clear and visually appealing charts and graphs.Actionable Insights: Gain valuable insights into student learning styles, preferences, and areas for improvement.Informed Decisions: Make data-driven decisions to enha
Subjects:
Grades:
PreK - 12th, Higher Education, Adult Education, Staff
Types:
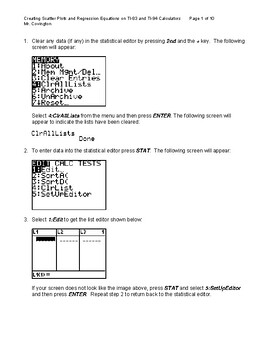
Creating Scatter Plots and Lines of best fit on TI-83/84 Graphing Calculator
A tutorial and reference guide for working with two-variable data to generate scatter plots and least squares method line of best fit on TI-83/84 graphing calculators and Microsoft Excel.
Subjects:
Grades:
8th - 12th, Higher Education, Adult Education
Types:
CEU Tracking Log for BCBA's
Excel spreadsheet with formulas to help track BCBA continuing education. The file has built-in formulas and data analysis, so some of the cells will auto-populate. Please reach out to me if you have any trouble with this file.
Grades:
Higher Education, Adult Education, Staff
Calculate Student's Final Marks ( Grades ) in excel
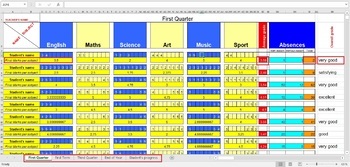
If you want to easily calculate student's marks this excel document is great solution. I added all excel's necesarily formulas to make this important task so easier.When you add the marks for every subject, it's final mark will be automatically calculated. At the same time average grade will also be calculated and updated.There is also section for absences (excused and unexcused) which will also be calculated.At the end, if student's Overall grade is equal or above 4.5, it will be automaticaly w
Subjects:
Grades:
PreK - 12th, Higher Education, Adult Education, Staff
Types:
Task Analysis Data Sheet for Brushing Teeth (Special Education, ABA, ASD)
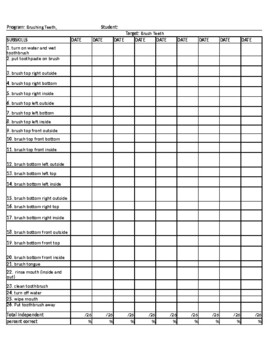
This is a detailed checklist/task analysis for an individual learning to brush their teeth or learning to accurately complete each step of the tooth brushing process. This form is also a datasheet- great for ABA therapy sessions at home or at school.
Grades:
PreK - 12th, Adult Education
Types:
MATH LESSON & MATH LAB on NFL Quarterback Rating
Most people have heard of professional football and the NFL but few people know that there is an actual formula used to calculate ratings for the NFL quarterbacks! This is a tried and true math lesson and lab that I have created and used for many years with my 7th and 8th grade classes. Students get a "kick" out of learning about the actual formula used by the NFL to calculate passer ratings for the quarterbacks. They learn some history about when the rating of quarterbacks first started, anal
Subjects:
Grades:
6th - 10th, Adult Education
Types:
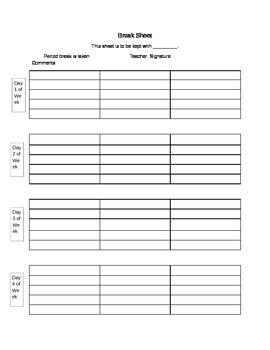
Sensory break sheet
This is a broken up excel worksheet that functions as a sensory break sign out sheet. This can be used to limit a students breaks, or could be altered for bathroom breaks, or really any other activity that happens daily and requires being checked out. It provides space for date, signature, and comment. This document can be edited to insert specifics or to add a student name.
Grades:
PreK - 12th, Higher Education, Adult Education, Staff
Types:

Stock Market Simulation
This product has a full lesson on how to teach students about the stock market. This allows them to actively work with different stocks to find out how stocks can shift and change over time. It can be adapted as a 9 weeks, semester, or even full year project.Included is an introductory PowerPoint, a sample Excel spreadsheet, a handout of the project instructions and a list of tips that I've learned using this that will help you out. This project was originally designed with an Economics class in
Subjects:
Grades:
6th - 12th, Higher Education, Adult Education
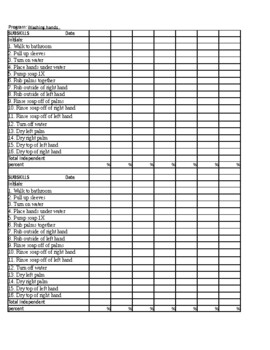
Washing Hands Task Analysis and Data Sheet (ABA, Special Education, ASD)
Great resource for teaching how to wash hands. This is a task analysis list and datasheet that can be used at home or in schools.
Grades:
PreK - 12th, Adult Education
Types:

REED and IEP worksheet
This is a great way to keep track of deadlines and IEP due dates. This has been very helpful in keeping me in check daily.
Grades:
PreK - 12th, Higher Education, Adult Education, Staff
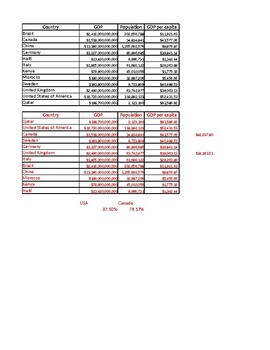
12 College Mathematics Data Management Answers
Answer keys for 12 College Data Management Activity. Different assignments so your students cannot copy with both answer keys side by side for easy marking.More different versions if desired, just message me.
Subjects:
Grades:
11th - 12th, Adult Education
Types:
Showing 1-22 of 22 results

