34 results
Middle school statistics printables for Microsoft PowerPoint
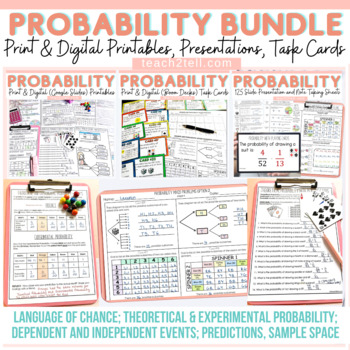
Chance and Probability Activities Theoretical & Experimental Probability Bundle
Are you teaching your students all about chance and probability and looking for fun hands-on probability activities? This print and digital bundle of worksheets, task cards, slideshows and note-taking sheets on Probability will reinforce the understanding of theoretical probability, experimental probability, language of chance, sample space, predictions, lists, tree diagrams, dependent probability events and independent probability events.Both US and British English spelling and terminology file
Subjects:
Grades:
4th - 7th
Geometry: Survey and Circle Graph Project Made Fun!
Circle Graph Geometry Activity - Everyone just wants their piece of the pie!This is a fun, multi-faceted project that will have your students creating and implementing a survey, converting their results using various mathematical operations, and creating a poster-sized circle graph incorporating various geometry skills.This Survey and Circle Graph Project Unit Includes:PowerPoint:-Fun, interactive, 3-part PowerPoint slide presentation that walks you and your students through the entire project f
Subjects:
Grades:
5th - 7th
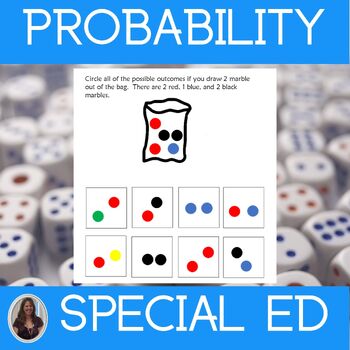
Chance & Probability Math Worksheets Special Education Statistics & Probability
This unit on Chance and Probability contains printable and digital math worksheets for special education. This statistics and probability unit is for students who take alternate assessments.This Chance and Probability unit helps students understand how to determine the probability of an event and all its possible outcomes. The worksheets, which use pictures and color coding, are differentiated. There are many ways for students to practice these skills in this unit that are at different levels.
Subjects:
Grades:
7th - 9th
Statistics Curriculum Statistics and Probability Special Ed Math Curriculum
Save $$$ with this Statistics Curriculum. This special ed math curriculum contains 8 units from my series on statistics including statistics and probability. They were developed for students with autism and special learning needs in middle and high school. Each unit is structured in the same way with similar content to enable your students to make connections and build on what they learn in each unit. This repetition of format helps ease anxiety and free up mental space when learning more di
Subjects:
Grades:
8th - 10th
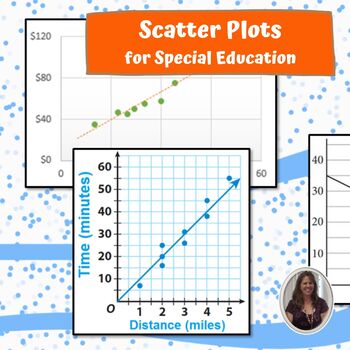
Scatter Plots for Special Education PRINT AND DIGITAL
This unit on Scatter Plots has almost 200 pages and 72 slides of material specifically designed for students with special learning needs, especially autism who are in middle and high school. This unit focuses on helping students interpret and read scatter plots. There are differentiated versions of the worksheets that use pictures and color coding. There are many, many worksheet for students to practice in this unit that are at different levels. There are MANY opportunities for students to e
Subjects:
Grades:
8th - 10th
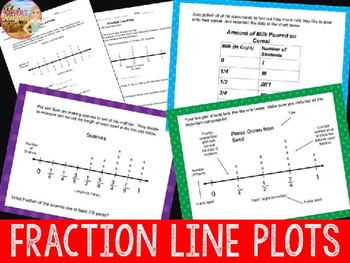
Fraction Line Plots Unit
Fraction Line Plots are easy to teach with this unit. Students will interpret line plots with addition and subtraction with these slides and accompanying worksheets.Students will evaluate ready-made fraction line plot data as well as learn how to make their own graphs from a given set of fraction data.Materials Included- Data Analysis Vocabulary Slide- 7 Interpreting Data Graphs (35 slides)- 3 Charts for Creating Graphs (10 slides)- 9 Student Sheets- Post-Test- Answer KeyNo-Prep SetupFor each se
Subjects:
Grades:
5th - 6th
CCSS:
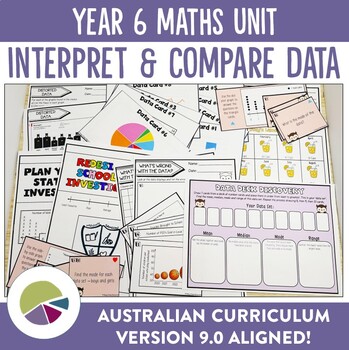
Australian Curriculum 9.0 Year 6 Maths Unit Data
Help your students complete statistical investigations with this unit plan and activity bundle. Bring your maths lessons to life as the unit plan walks you through everything you need to thoroughly cover the AC9M6ST01, AC9M6ST02 and AC9M6ST03 elements of the Australian Year 6 Maths curriculum (version 9.0). Fun for students, easy for you to implement and an irresistible way to help budding mathematicians learn how to use statistics!Bring the fun back into using data as you guide your students th
Subjects:
Grades:
5th - 7th
Also included in: Ultimate Australian Curriculum 9.0 Year 6 Units Bundle
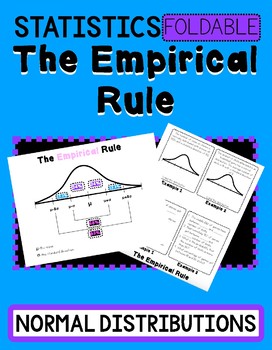
The Empirical Rule- Normal Distribution Foldable & Powerpoint
This resource is for the empirical rule. Students will label normal distributions with 2 real-world scenarios.This resource is accompanied by an animated Powerpoint and or Keynote file to present in the classroom. The presentation includes 8 additional examples. All answer keys are included.Printing:When printing the foldable set the printer to flip on the short side. You will fold the paper “hamburger” style just enough to show the title, The Empirical Rule.Sign up for my email list for freebie
Subjects:
Grades:
8th - 10th
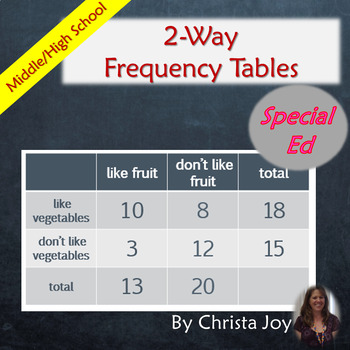
2-Way Frequency Tables for Special Education PRINT AND DIGITAL
This unit on 2-Way Frequency Tables has almost 200 pages and 76 google slides of material specifically designed for students with special learning needs, especially autism who are in middle and high school. This unit focuses on helping students interpret, read, and create 2-Way Frequency Tables as well as Venn Diagrams. There are differentiated versions of the worksheets that use pictures and color-coding. There are many, many worksheet for students to practice in this unit that are at differ
Subjects:
Grades:
8th - 10th
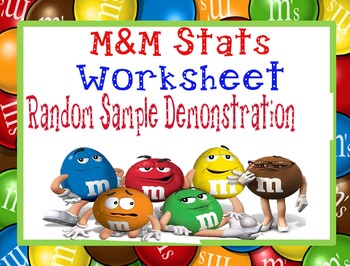
Psychology Random Sample Population Stats M&M Worksheet for Research Methods
Psychology or Statistics Random Sample & Population Statistics M&Ms Worksheet Activity for Research Methods includes a teacher direction sheet with materials that you need and how to complete the activity along with printable handout for students. *Student Favored activity*Please email me with any questions at ReadySetLearnSocialScience@yahoo.comIf you would like to get updates on NEW and CURRENT resources...►FOLLOW Me on Teachers Pay Teachers►FOLLOW Me on Pinterest►FOLLOW Me on Instagr
Subjects:
Grades:
4th - 12th, Adult Education
Types:
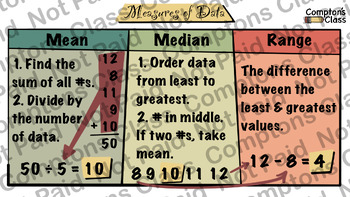
Compton's Class Data And Statistics 6th Grade Math Package
5 Anchor Charts that deals with Data and Statistics.
Subjects:
Grades:
6th

Mission Series #1: Averaging
Students are placed on a mission to help the teachers of Peace University average their semester grades. They are given five teacher gradebooks and asked to find the mean for each student. Guaranteed to make learning fun and engaging! Students feel a sense of adventure as they complete this simple lesson in the form of a quest. They show their understanding of this statistic concept while they fulfill their assignment. Answer Keys included.
Subjects:
Grades:
6th - 8th, Adult Education
Types:
CCSS:
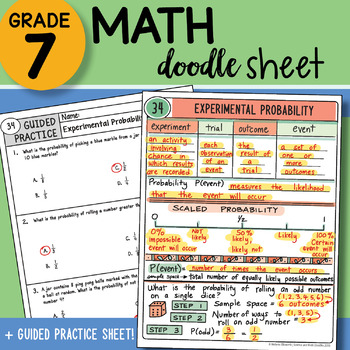
Math Doodle - Experimental Probability - Easy to Use Notes with PPT
7th Grade Math Doodle Sheet Product INCLUDES:Math Doodle Sheet - blank and keyGuided Practice Sheet - blank and keyPowerPoint – to show students the KEY– two versions of both sheets included: INB and large 8.5 x 11 size ALL TEKS Aligned– plan for the FULL year included with table of contents page for INB! SAVE BIG and buy the WHOLE YEAR SET found here:7th Grade Math Doodle Sheets ALL YEAR SET WHOLE YEAR SET List below:ALL TEKS Aligned– plan for the FULL year included! LIST of 88 Doodle Sheets p
Subjects:
Grades:
6th - 8th
Chance and data (probability) multiple choice math test
Chance and data (probability) multiple choice math testIncludes:- 24 multiple choice math questions- finding probability with dice, spinners, bar charts and colored ballsTags:chance and data, probability, multiple choice, chance with dice, chance with spinners, chance test questions, probability test, probability questions
Subjects:
Grades:
5th - 8th
Types:
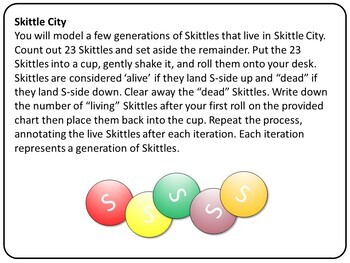
Skittle City: A Fun Mathematical Modeling game for recursion and probability
This exercise is incredibly fun! It is designed to challenge students to explore data analysis and discover about the math concepts of recursion and probability. Students break up in groups and work on modeling a notional Skittle City population. I firmly believe that experience should come before learning formal math formulas and definitions. This is a great way to get the students engaged and have them learn these concepts without even realizing it!Full instructor guide and Answer Key included
Subjects:
Grades:
3rd - 12th
Types:
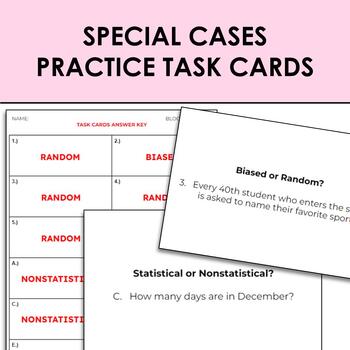
Statistical Questions and Biased vs. Random Practice Task Cards
Give your students to opportunity to practice statistical vs. non-statistical questions, and biased vs. random sampling. These task cards to hang/place around the room provide the chance for repetitive practice of deciding whether a question is statistical or non-statistical, as well as choosing whether a sampling technique is biased or random for the given population. You could even pull small groups of students while other students work on this task independently or with partners. Includes all
Subjects:
Grades:
6th - 8th
Types:
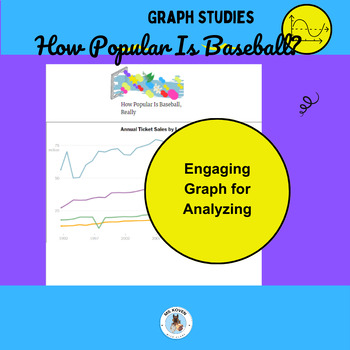
Analyzing Graphs: Analyze Baseball's Popularity, Text & Questions, Middle School
Explore the paradigm shift in the popularity of baseball with our in-depth graph study. Analyze comprehensive data relating to Major League Baseball’s perceived decline and contrasting ticket sales figures, local broadcast ratings, and comparative analysis with the NFL and NBA.This multifaceted study offers educators a detailed overview, coupled with comprehension questions, a teacher's guide for sample answers, a student-friendly rubric, and associated standards, facilitating a nuanced explorat
Subjects:
Grades:
6th - 8th
Also included in: Analyzing Graphs: Real-World Data Analysis Bundle, Middle School
Probability Worksheets, PowerPoints and Interactive Resources
Get to grips with basic probability theory. These activities begin with a range of literacy tasks and posters, then then go on to cover probability words, fractions and sums. Experimental activities are used to test the theory, before moving on to more difficult examples of multiple spinners and dice. A number of Excel tools are included. One, for example, totals and graphs 100 random rolls of a die at the click of a button. Repeated use builds up a picture that time would not otherwise allow. 2
Subjects:
Grades:
6th - 9th, Adult Education
Graphing the Mean | Your Mean Student - Project Based Learning
Graphing the Mean - Your students will experience a math task that will lead to a group presentation. They will compose questions, collect data, collate data, determine the ‘mean’, show the data in various graphs and design a poster to present the ‘mean student’.Slides include-What the unit will cover-How mean are you? What will you be looking for?-What is the mean?-How mean are you?-Template for recording the mean student-Ideas for recording data-Group guidelines – it’s your turn-Types of graph
Subjects:
Grades:
4th - 6th
Mean, Median, Mode, and Range Lesson
This is a thorough lesson on finding the mean, median, mode, and range of a set of numbers. Here are the details:In the 30-slide PowerPoint presentation:Definitions of the terms mean, median, mode, and range."Let's talk about it" slides to elicit student ideas about each topic"Pause and reflect" slides to elicit deeper thinking about each topic"Now it's your turn!" slides to gauge student comprehension after each topic (Answers included)An exit ticket to end the lesson (Answers included)In the
Subjects:
Grades:
6th - 7th
Also included in: Bundle: Mean, Median, Mode, & Range
FRENCH MATHS | CHARTS | DIAGRAMMES | REPRÉSENTATION GRAPHIQUE | INTERPRÉTER
Creating charts that are precise, effective, visually appealing and authentic is a pretty big feat! Do away with the anchor chart paper and the countless hours or prep-work and use these to amp up your teaching! I use these with my grades 5 and 6 students in my split class, but they can easily be used as Reachback or revision in grade 7 or for students needing extra exposure; like younger students who are enriched or older students who are in adaptation scolaire.This collection of 11 charts with
Subjects:
Grades:
5th - 6th
Types:
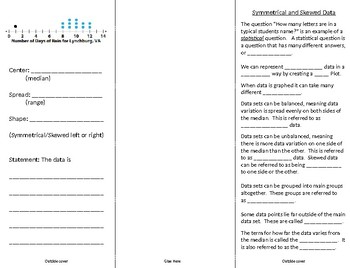
Symmetrical and Skewed Data Lesson
TEKS
use the graphical representation of numeric data to describe the center, spread, and shape of the data distribution .[6.12B]
summarize numeric data with numerical summaries, including the mean and median (measures of center) and the range and interquartile range (IQR) (measures of spread), and use these summaries to describe the center, spread, and shape of the data distribution.[6.12C]
Subjects:
Grades:
6th - 8th

La Statistique et la Probabilité
This lesson pack includes a powerpoint introduction to statistics and probability. I have used this lesson with students in grades 7 through 9 (as either an introduction or a review). The powerpoint lesson includes some terms, notes, interactive questions and activities, notes for the teacher where required below slides. Afterwards, there is a printable PDF project that students complete either individually or as partners using Skittles, and paper cups. The project also has students review gra
Subjects:
Grades:
7th - 9th
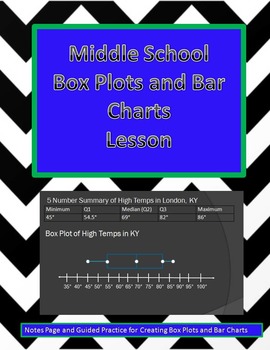
SP.4 Box Plots and Bar Charts Middle School Math Practice
SP.4 Bar Charts and Box Plots description
This lesson includes data, examples, and key vocabulary for students to practice creating box blots and bar charts.
There is a Powerpoint with step by step guidance and 4 pages of worksheets for students. You can adapt this lesson to all learning types. For example, the PowerPoint can guide struggling learners with examples and answers or you can use just the worksheets for advance students to practice. Teacher keys are included. I have also included so
Subjects:
Grades:
6th - 8th
Showing 1-24 of 34 results


