131 results
Statistics printable pdfs $5-10
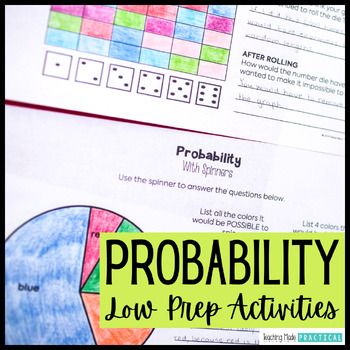
Probability Activities - Fun Review Worksheets, Spinners, Dice, Task Cards
These low prep probability activities and worksheets make a great introduction or review. Students will practice probability vocabulary - certain, impossible, possible, likely, unlikely, and equally likely - and apply these words in a variety of situations and events. Students will also get the opportunity to think about different probability events with hands on practice using spinners, coins, and dice. The fun probability activities include: 6 anchor charts / probability posters to help stu
Subjects:
Grades:
2nd - 5th
Types:
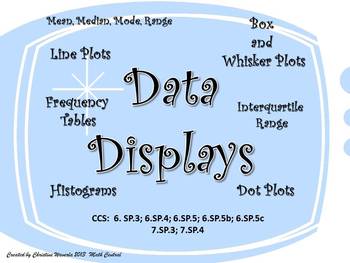
Data Displays: Line Plots, Histograms, Box and Whisker Plots, Frequency Tables
This is one of my favorite teaching tools! I created this Data Display set of worksheets this year for my 6th grade class. My students loved using these worksheets to practice their new skills. Each worksheet provides plenty of room for students to create their data displays and answer questions based on the data. Questions ask students to find the mean, median, mode, range, interquartile range, and percentages.These worksheets are fully aligned with the Common Core Curriculum.CCS: 6.SP.3; 6.SP
Subjects:
Grades:
6th - 8th
Types:
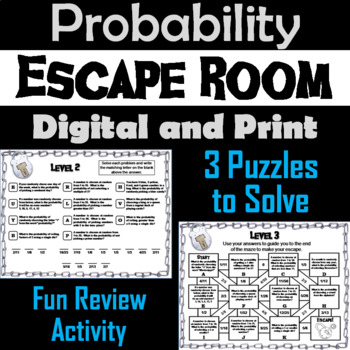
Simple Probability Activity: Escape Room Math Breakout Game
This breakout escape room is a fun way for students to test their skills with probability. Important: (How to Make Completely Digital)This product normally requires the printing of the questions to accompany a digital form for students to input answers. But if you follow a couple simple steps, this can be made entirely digital! Just use the following tool:https://smallpdf.com/split-pdf(choose "extract pages")to extract the pages containing the questions into its own PDF. You can then upload t
Subjects:
Grades:
4th - 6th
Types:
Probability and Tree Diagrams: A 78-Page Activity Resource
Updated 2017: Fonts have changed for better legibility and background changes.
This 78-page product is designed to teach, practice, review, and assess students’ knowledge of probability and tree diagrams. Besides lots of activities on probability, it also integrates students practicing converting fractions to decimals to percents in several activities.
You will find quality activities that are designed to get students actively participating in their learning and having a blast while doing it.
Subjects:
Grades:
3rd - 7th
Types:
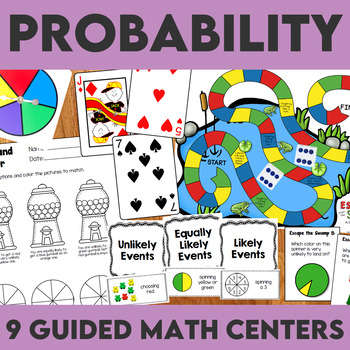
Probability Guided Math Centers | Probability Activities
These hands-on guided math probability centers will engage students in authentic, meaningful learning activities while you work with student groups! These best-selling math centers are a must-have for your classroom!⭐ These math centers are also available in a Year-Long Bundle with all my other Guided Math centers! This set of probability centers is perfect for:✔ Grade 2 and Grade 3 classrooms✔ Teachers who don't want to prep math activities daily✔ Teachers who believe in hands-on learning✔ T
Subjects:
Grades:
2nd - 4th
Types:
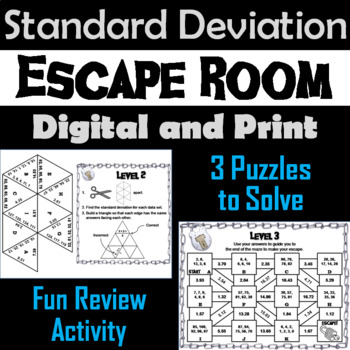
Standard Deviation Activity: Escape Room Algebra Breakout Game (Statistics Unit)
This breakout escape room is a fun way for students to test their skills with calculating standard deviation. Contents: ♦ Teacher Instructions and FAQ ♦ 3 Levels to decode: Multiple Choice, Tarsia Puzzle, and Maze ♦ Student Recording Sheet and Teacher Answer Key ♦ Link to an optional, but recommended, digital breakout roomCheck out the preview and the video preview for more details! - The video preview will show the correct puzzles for this escape
Subjects:
Grades:
8th - 12th
Types:
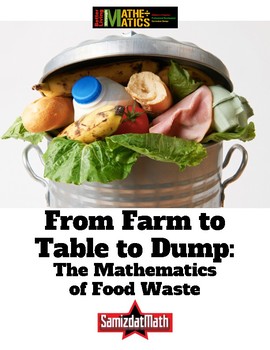
Food Waste and Mathematics: From Farm to Table to Dump
Here's a very uncomfortable fact: it takes 4 pounds of potatoes to make 1 pound of potato chips. That means that for every 1 pound bag of potato chips you eat, 3 pounds of potatoes have to be thrown away. What a waste of food! This is a series of activities that looks at the hidden world of food waste. It includes a look at how much food is wasted as it is "processed" into finished products like french fries and potato chips. It also includes mathematical activities where students calculate how
Subjects:
Grades:
5th - 12th, Adult Education
Types:
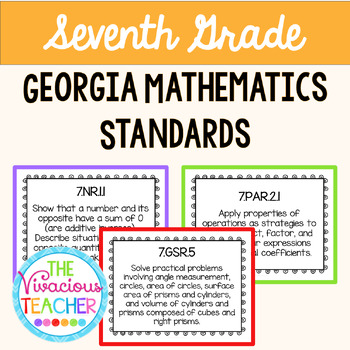
Georgia Mathematics Standards Posters for Seventh Grade
This pdf file includes Georgia Mathematics Standards posters for Seventh Grade. They have been updated for the 2023-2024 school year. These posters were designed in black and white so you can save your color ink! I print these posters on colored card stock and laminate so they are ready to hang in my classroom year after year.Standards included:Mathematical Practices and ModelingNumerical ReasoningPatterning and Algebraic ReasoningGeometric and Spatial Reasoning♥♥♥♥♥♥♥♥♥♥♥♥♥♥♥♥♥♥♥♥♥♥♥♥♥♥♥♥♥♥♥♥♥♥
Subjects:
Grades:
7th
Mean, Median, Mode, and Range Worksheets
Mean, Median, Mode, and Range Worksheets.Package includes 100 worksheets.Answers included.You May Also Like These Worksheets:Averages WorksheetsYou May Also Like These Task Cards:Mean, Median, Mode, and Range Task CardsMean Task CardsBe the first to know about my new discounts, freebies and product launches:- Look for the green star next to my store logo and click it to become a follower. You will now receive email updates about this store.- Follow me on Facebook- Follow me on Pinterest
Subjects:
Grades:
3rd - 6th
Types:
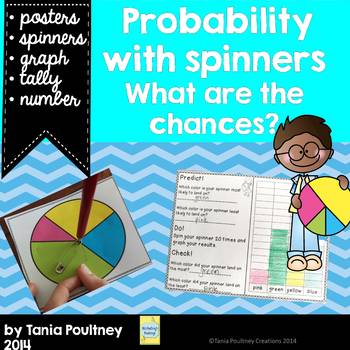
Chance and Probability
Need to practice probability? These interactive, hands on spinners will be a great addition for whole class, individual student work or maths centers about probability. This will not only help students understand the language of probability but will also generate discussion and thinking about why probability occurs. Included is a BONUS marbles in a bag activity to follow up and consolidate learning.
Australian Curriculum: ACMSP047
Included in this pack are:
* 15 unique spinners with varying
Subjects:
Grades:
2nd - 4th
Types:
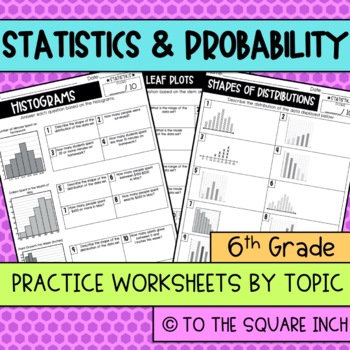
Statistics Practice Worksheets
6th Grade Math Statistics Worksheets-This set of printable worksheets is a perfect way to give your students additional practice on 6th grade math topics. Each page has 10 practice questions. This aligns with the To the Square Inch 6th Grade Math Curriculum and follows the Common Core Standards. It is easy to mix and match sets to meet your individual standards.Topics covered in this product: Statistical QuestionsShapes of DistributionsFinding MeanFinding ModeFinding MedianFinding RangeQuartiles
Subjects:
Grades:
6th
Georgia Mathematics Standards Posters for Sixth Grade
This pdf file includes Georgia Mathematics Standards posters for Sixth Grade. They have been updated for the 2023-2024 school year. These posters were designed in black and white so you can save your color ink! I print these posters on colored card stock and laminate so they are ready to hang in my classroom year after year.Standards included:Mathematical Practices and ModelingNumerical ReasoningPatterning and Algebraic ReasoningGeometric and Spatial Reasoning♥♥♥♥♥♥♥♥♥♥♥♥♥♥♥♥♥♥♥♥♥♥♥♥♥♥♥♥♥♥♥♥♥♥♥♥
Subjects:
Grades:
6th
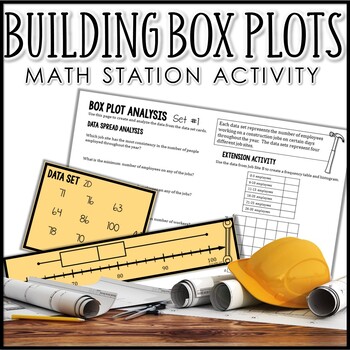
Box Plots Center
This math activity provides your students practice in drawing, interpreting, and analyzing box plots (box-and-whisker diagrams). Students use data sets to create or match a box plot and use it to find measures of center, spread, and interpret the shape of graph. Each of the five data sets included is related to real-world scenarios that might be encountered in a construction job site setting.Students use the data to calculate the interquartile range (IQR), median, minimum, maximum, and range o
Subjects:
Grades:
6th - 7th
Types:
Also included in: 6th Grade Math TEKS Mega Bundle
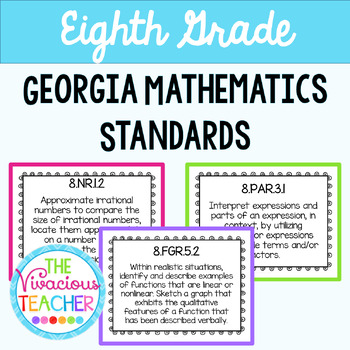
Georgia Mathematics Standards Posters for Eighth Grade
This pdf file includes Georgia Mathematics Standards posters for Eighth Grade. They have been updated for the 2023-2024 school year. These posters were designed in black and white so you can save your color ink! I print these posters on colored card stock and laminate so they are ready to hang in my classroom year after year.Standards included:Mathematical Practices and ModelingNumerical ReasoningPatterning and Algebraic ReasoningFunctional and Graphical ReasoningGeometric and Spatial Reasoning♥
Subjects:
Grades:
8th
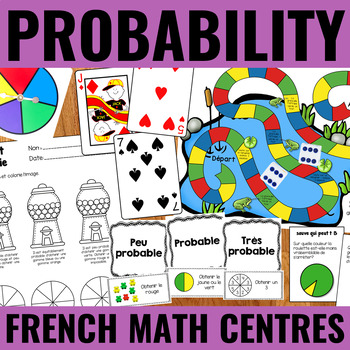
FRENCH Probability Centres for Guided Math
These hands-on French probability centres will engage students in authentic, meaningful learning activities while you work with student groups! These best-selling math centres are a must-have for your classroom!⭐ These math centres are also available in a Year-Long Bundle with all my other Guided Math centres!This set of probability centres is perfect for:✔ Grade 2 and Grade 3 French math classrooms✔ Teachers who don't want to prep math activities daily✔ Teachers who believe in hands-on learning
Subjects:
Grades:
2nd - 4th
Types:
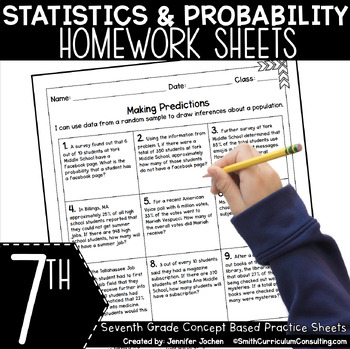
7th Grade Math Homework Sheets Statistics and Probability Math Worksheet
Practice makes progress, right? Each of the included Practice Sheets for standards (some broken down into separate parts depending on skill) for Statistics and Probability in 7th Grade are easy to use and implement for extra practice, homework, or even a quick assessment.This pack includes a Practice Sheet for each standard (some broken down into separate parts depending on skill) for Statistics and Probability in 7th Grade.Included in this download are:Alignment documents for TEKS and CCSS8 Pra
Subjects:
Grades:
7th
Types:

Sickle Cell Data Analysis: Hardy-Weinberg and Chi-Square
Want a great way to convert the "traditional" Hardy-Weinberg lab into a data problem set? Here it is! This is ideal for very small classes, where sample size could be an issue, busy classes, where you may need this for additional at-home practice, or very large classes, where the swapping of H-W cards could get too messy.Included is the full data problem set and teacher pages with the answer key.This data problem set covers:-genotypes and phenotypes-the Hardy-Weinberg equation, with application
Subjects:
Grades:
10th - 12th, Higher Education
Types:
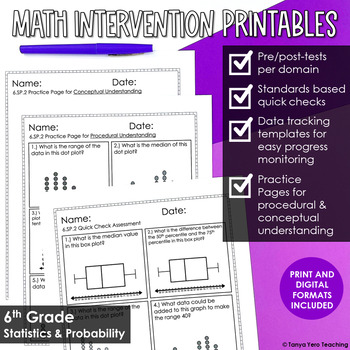
6th Grade Math Intervention Statistics & Probability | RTI Progress Monitoring
A comprehensive, no prep, standards-based pack of RTI 6th grade math intervention resources for the statistics and probability standards. This research-based intervention pack includes tools for building a systematic, data-driven intervention process.With pre/post-tests for executing screening, quick checks for progress monitoring, practice pages for guided and independent practice and data tracking forms, this math intervention resource will organize and transform your intervention instruction.
Subjects:
Grades:
6th - 7th
Types:
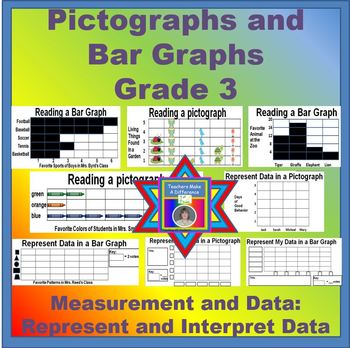
Pictographs and Bar Graphs - Grade 3
COMMON CORE STATE STANDARDS FOR MATHEMATICS
Grade 3 Measurement and Data: Represent and Interpret Data
CCSS.Math.Content.3.MD.B.3 Draw a scaled picture graph and a scaled bar graph to represent a data set with several categories. Solve one- and two-step “how many more” and “how many less” problems using information presented in scaled bar graphs. For example, draw a bar graph in which each square in the bar graph might represent 5 pets.
This activity set will develop your students’ ability t
Grades:
3rd
Types:
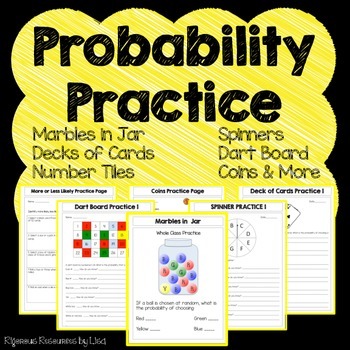
Probability
Do your students need practice with probability? This product will help your students master many different types of probability problems.
This product includes the following 60 pages:
Page 1: Cover Page
Page 2-3: Marbles in a Jar Whole Class Page & Answer Sheet
Page 4-13: Marbles in a Jar Student Practice Pages & Answer Sheets
Pages 14-15: Deck of Cards Whole Class Page & Answer Sheet
Pages 16-25: Deck of Cards Student Practice Pages & Answer Sheets
Pages 26-27: Dartboard W
Subjects:
Grades:
4th - 7th
Types:

Differentiated Daily Math: Data Management
Get your students collecting data and creating bar graphs, double bar graphs, stem and leaf plots, and line graphs every day.
Easily differentiated to meet the needs of a variety of learners from grades 3-6 in your classroom.
These pages will help students
Design a survey
Conduct a survey
Gather data
Create a variety of graphs
Interpret, compare and analyze data
Calculate the mean, median and mode of a set of data
Subjects:
Grades:
3rd - 6th
Types:
Also included in: Daily Math Warm Ups Grade 3-6 - Differentiated Daily Math Practice Pages
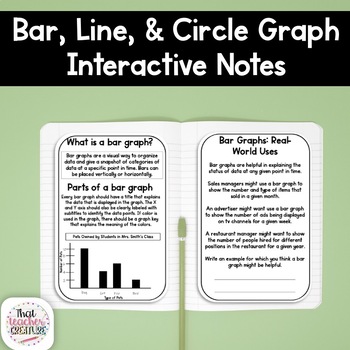
Bar, Line, and Circle Graph Interactive Notes
Make teaching bar, line, and circle graphs easier with these interactive notes! This no-prep set includes 3 sets of interactive notes perfect for exploring types of graphs. Quick and easy setup helps save you time and provides students with notes they need to understand the purpose, parts, and real-world uses of each type of graph. Here's what you'll get:purpose of a bar, line, and circle graphparts of a bar, line and circle graphreal world application of each type of graphguided practice - crea
Subjects:
Grades:
4th - 12th
6th Grade Math I Can Statements and Word Wall (Set 4)
6th Grade Math "I CAN" Statements and Word Wall for STAAR Reporting Category 4:
19 "I CAN" statements and 22 "Word Wall" cards
Help increase math literacy by posting these student friendly, illustrated objectives and word wall words in your classroom.
These colorful "I CAN" statements are based on the NEW 2014 TEKS.
STAAR organizes the TEKS into 4 reporting categories. This is Set 4 of 4.
This product is based on the following Texas standards:
Readiness Standards:
6.12(C) summarize nu
Subjects:
Grades:
6th
Types:
Grade 8 Common Core Math Worksheets: Statistics and Probability 8.SP 1-4
Common Core State Standards - Grade 8 Mathematics
These 12 worksheets contain math problems aligned with the 8th grade common core state standards (CCSS) listed below.
[SP Statistics and Probability]
Investigate patterns of association in bivariate data.
1. Construct and interpret scatter plots for bivariate measurement data to investigate patterns of association between two quantities. Describe patterns such as clustering, outliers, positive or negative association, linear association, and
Subjects:
Grades:
8th
Types:
Showing 1-24 of 131 results


