22 results
1st grade statistics graphic organizers for parents
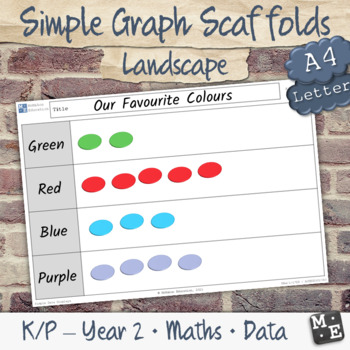
GRAPHING DATA Simple Picture Column Bar Graph Blank Scaffolds (Landscape)
Introduce students to arranging and representing data in rows or columns, with these printable graph scaffolds.By using these scaffolds students will:Use concrete materials, pictures or drawings as symbols to create data displays with one-to-one correspondenceGroup objects according to certain characteristicsArrange objects in rows or columns to form data displaysInterpret information presented on each data displayThis resource contains blank, A4/letter size scaffolds in landscape orientations:2
Subjects:
Grades:
K - 2nd
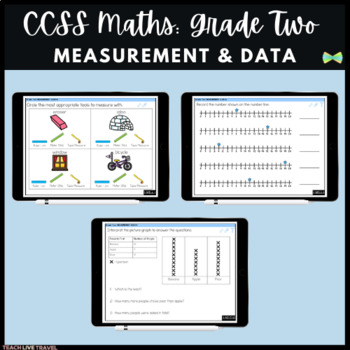
Grade Two Math | Measurement & Data | CCSS | Seesaw Activities | Online Learning
Do you need to review CCSS Measurement & Data with your learners?These CCSS Seesaw Math Activities by Teach, Live & Travel were designed with your little learners in mind, allowing them to develop their Measurement & Data knowledge, and consolidate their math skills in a purposeful, engaging way!How could I use these in my classroom?»Pre-Assessments or Post-Assessments - check your students prior knowledge and gaps to inform your learning and teaching»Small group teaching - work with
Subjects:
Grades:
1st - 3rd
Also included in: Grade Two Math BUNDLE | CCSS | Seesaw Activities | Online Learning
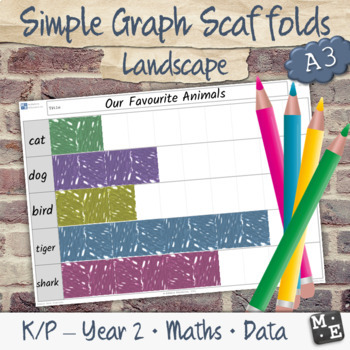
GRAPHING DATA Simple Picture Column Bar Graph Blank Scaffolds (A3 Landscape)
Introduce students to arranging and representing data in columns, with these printable graph scaffolds.By using these scaffolds students will:Use concrete materials, pictures or drawings as symbols to create data displays with one-to-one correspondenceGroup objects according to certain characteristicsArrange objects in rows or columns to form data displaysInterpret information presented on each data displayThis resource contains blank, A3 size scaffolds in landscape orientations:2,3,4,5,6,7, and
Subjects:
Grades:
K - 2nd
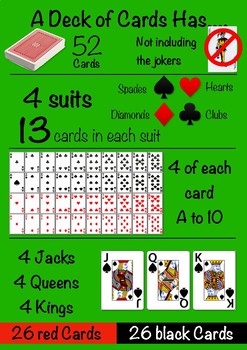
Chance, Statistics and Probability Playing Card Poster
This classroom display provides an engaging visual and supportive teaching aide for the teaching of probability facts related to a standard deck of playing cards.
Use this vivid resource to compliment your chance and probability lessons or simply to brighten up your mathematics display area.
Subjects:
Grades:
PreK - 12th
Types:
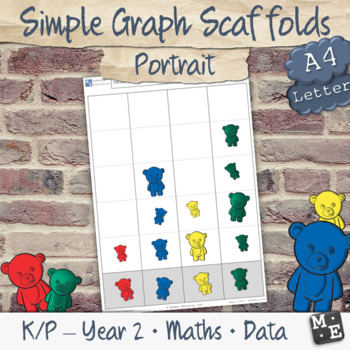
GRAPHING DATA Simple Picture Column Graph Blank Scaffolds (Portrait)
Introduce students to arranging and representing data in columns, with these printable graph scaffolds.By using these scaffolds students will:Use concrete materials, pictures or drawings as symbols to create data displays with one-to-one correspondenceGroup objects according to certain characteristicsArrange objects in rows or columns to form data displaysInterpret information presented on each data displayThis resource contains blank, A4/letter size scaffolds in portrait orientations:2, 3, 4 an
Subjects:
Grades:
K - 2nd
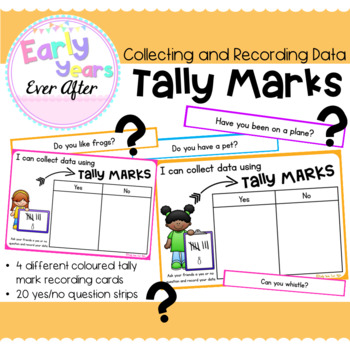
Tally Mark Collecting and Recording Data
Are your learners investigating data? Are they learning to ask yes and no questions to collect information? Are they experimenting with tally marks? This resource allows your students to work in groups to ask, collect and record data using tally marks. Simply print and laminate! There are 4 different coloured recording cards and 20 different yes/no question strips. Perfect for small group instruction when introducing tally marks or for use in centres and rotations. Like this product? Don't forge
Subjects:
Grades:
K - 2nd
CCSS:
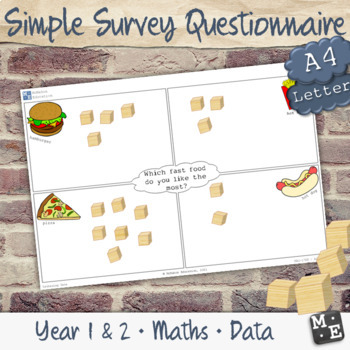
COLLECTING DATA Simple Survey Questionnaire Worksheet Scaffolds
Investigate your student's interests as they gather data about their peers with these quirky printable survey sheets.By working through these tasks, students have the opportunity to observe and analyse emerging trends as they make comparisons between the various interests of their classmates. They will be able to formulate their own survey questions, and practice their mathematical and social communication skills while they conduct their questionnaires. They will track their data points using co
Subjects:
Grades:
1st - 2nd
CCSS:
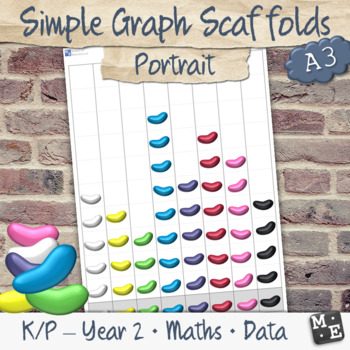
GRAPHING DATA Simple Picture Column Graph Blank Scaffolds (A3 Portrait)
Introduce students to arranging and representing data in columns, with these printable graph scaffolds.By using these scaffolds students will:Use concrete materials, pictures or drawings as symbols to create data displays with one-to-one correspondenceGroup objects according to certain characteristicsArrange objects in rows or columns to form data displaysInterpret information presented on each data displayThis resource contains blank, A3 size scaffolds in portrait orientations:2, 3, 4 and 5 col
Subjects:
Grades:
K - 2nd
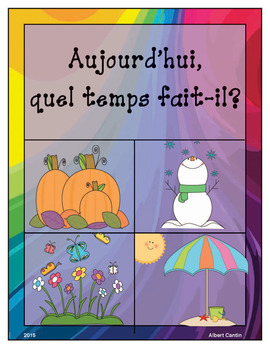
D02-Aujourd'hui, quel temps fait-il?
Le diagramme à bandes est la façon idéale de représenter une idée qui se continue dans le temps. En plus d’engager activement les enfants dans diverses activités physiques et intellectuelles, il leur montre visuellement la progression des éléments. Les enfants peuvent s’en servir pour observer, analyser et comparer les éléments inclus dans différents champs d’études interdisciplinaires, par exemple, le français oral et écrit, les mathématiques, les sciences naturelles, la musique et les arts vis
Subjects:
Grades:
1st - 2nd

MedAware Labels and Chart Kit Booklet
Always Know When, What, Why and How Medications are taken.
(Avoid under and overdosing prescription, generic and other drugs).
Subjects:
Grades:
PreK - 12th, Higher Education, Adult Education, Staff
Mathematics Planning and Assessment Organisation (F-2 Victorian Curriculum)
I made this resource based on experience as a classroom teacher and a Curriculum Team Leader for Foundation/Prep, as well as working in many, and leading a few, F-2 PLC meetings involving cycle of inquiries. One real challenge is understanding exactly where our students are working on the 3 mathematics continuums: number & algebra, measurement & geometry and statistics & probability. Once we identify students’ knowledge, skills and dispositions we then need to plan ‘just right’ learn
Subjects:
Grades:
K - 2nd
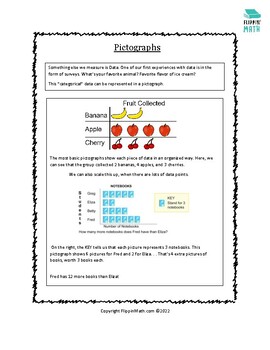
Pictographs (M4P.E33)
This one-page notes worksheet is meant to concisely explain what a pictograph is, and how it can be used to represent data. It is a part of a series of resources created to accompany the book, Math for Parents: Elementary Edition. Find more resources here on TPT, or on my website @ flippinmath.com.
Subjects:
Grades:
K - 3rd
Types:
CCSS:
Also included in: Math for Parents: Elementary Edition
Elementary Probability Parent Handouts (Help at Home)
This item includes tips for parents to help their child at home with elementary probability. Very convenient for busy teachers and students alike.------------------------------------------------------------------------------------------------INCLUDES:-Parent Letter (encourages help at home)-Probability Parent Teaching Tips------------------------------------------------------------------------------------------------*5 Pages Total.-Look for similar versions of this product in my store by searchi
Subjects:
Grades:
1st - 4th
Types:
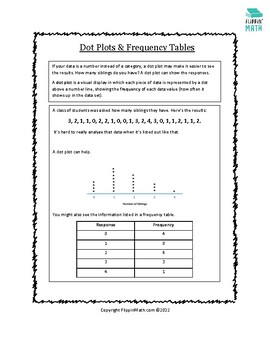
Dot Plots (M4P.E34)
Dot plots and frequency tables can be used to show responses to survey questions. This one-page notes worksheet explores these two data representations in a concise way. It is a part of a series of resources created to accompany the book, Math for Parents: Elementary Edition. Find more resources here on TPT, or on my website @ flippinmath.com.
Subjects:
Grades:
1st - 6th
Types:
CCSS:
Also included in: Math for Parents: Elementary Edition
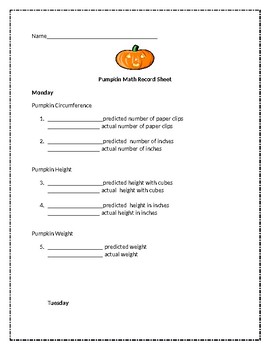
Pumpkin Math (Week Long Activities)
Throughout this fun filled week, children will explore:
-Circumference
-Weight
-Volume
- Distance
These are different hands on activities for each day of the week (Mon-Thurs)
Subjects:
Grades:
1st - 4th

Estimation Jar parent letter
This letter is editable for you to add or delete, and to change your name. Good luck!
Subjects:
Grades:
1st - 5th
Types:
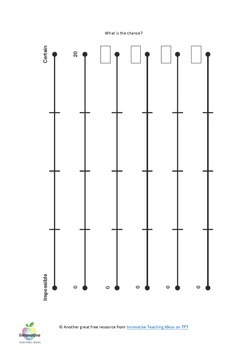
FREE Chance and Probability Graphic Organizer | Odds | Data | Math
The purpose of this tool is to assist students in assessing the mathematical chance or probability of an event occurring. For instance, you might raise the following questions.What is the chance of rain in July?What is the chance of a golfer hitting a hole-in-one on a short par three hole?What is the chance of someone in our school wearing pink socks?What is the chance of (insert team name) winning a championship this season?This organizer is an excellent tool for starting the mathematical und
Subjects:
Grades:
1st - 6th
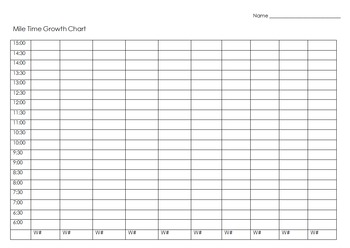
Mile Time Growth Chart
Help your students monitor their own growth in running a timed mile by giving each of them this chart. It can easily be incorporated into math (graphing, statistics, data analysis), or paired with any Growth Mindset teaching in PE. Enjoy!
Subjects:
Grades:
1st - 12th
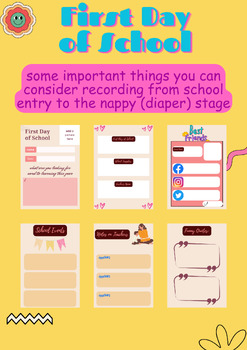
First Day of School
Remember that the key is to document things that feel significant to you and your child. These records will become cherished memories that you can look back on with fondness as your child grows up
Subjects:
Grades:
PreK - 9th

Common Core Standards for Measurement and Data for K-5
The Common Core Standards for Measurement and Data for K-5 are listed.
Subjects:
Grades:
K - 5th
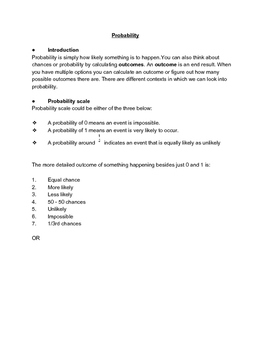
Probability
What is probability, probability scale, types of probability depending on various factors , calculating probability using tree diagram, problem statements.
Subjects:
Grades:
K - 2nd

Sochi Olympic Medal Tally
A tally chart to keep track of Olympic achievement. Can be editted to fit classroom needs.
Subjects:
Grades:
PreK - 12th
Showing 1-22 of 22 results


