38 results
High school graphing resources for Microsoft OneDrive and for parents

Exponential Functions Introduction Activity in Digital and Printable
Engage students with this intro lesson that will get them thinking exponentially.Included in download:Would you rather? Choices to get students thinking (PDF and Google Forms Poll included)Table and Graph for students to explore linear vs. exponential results of the given choices (printable PDF, Google Sheets, and Microsoft Excel versions included)Answer KeyExponential functions are a difficult concept for students because they are used to thinking about linear relations. Before telling students
Grades:
8th - 9th
Types:
CCSS:
Also included in: Algebra 1 Discovery Lessons and Inquiry Activities Bundle
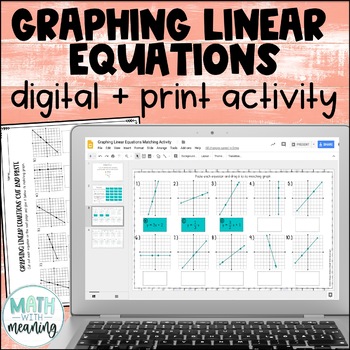
Graphing Linear Equations Digital and Print Activity for Google Drive
Looking for an engaging, no-prep activity to practice matching linear equations to their graphs? Students will match 20 equations to their graphs with this fun digital and print activity. Many of the equations are very similar and involve the same numbers, so students will need to work carefully!All equations are written in slope-intercept form. The graphs include positive, negative, zero, and undefined slopes. Please view the preview file to make sure that this activity is appropriate for your
Grades:
6th - 9th
CCSS:
Also included in: Middle School Math Digital and Print Activity Bundle Volume 2

Rates & Proportional Relationships Real World Project
Students work with real world rate of change and proportional relations as entrepreneurs creating a business startup! They will love getting creative, and you will love that everything is ready to go to get them thinking about math. This project is included in printable PDF version, Google Slides, and PowerPoint.In this project, students get creative as they decide on a type of business, membership fees, and a building location. Then they must calculate their costs and profits based on those dec
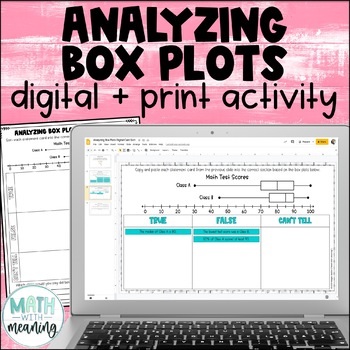
Box and Whisker Plot Digital and Print Card Sort - Reading and Analyzing
Looking for an engaging, no-prep activity to practice reading and analyzing box plots? Students will look at a double box plot and determine if statements about it are true, false, or if they can't tell from the information given in this fun digital and print activity.This activity includes statements about the minimum, maximum, median, quartile 1 (Q1), quartile 3 (Q3), interquartile range (IQR), and range of the box plots, along with statements about the percentages represented by a particular
Subjects:
Grades:
6th - 9th
Also included in: Middle School Math Digital and Print Activity Bundle Volume 3
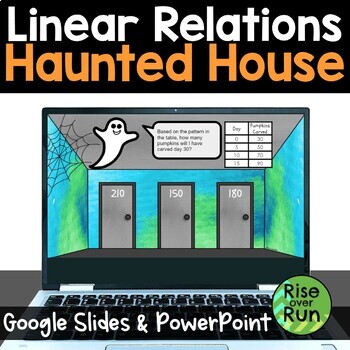
Digital Linear Relationships Halloween Escape Room Activity
Students will love this engaging practice activity for linear relationships. They must try to escape a haunted house! Includes Google Slides and PowerPoint versions. They are given 14 problems to solve, choosing from 3 possible answers for each one. If they solve correctly, they will choose the correct door and avoid the scary giant spiders! If they make a mistake, a spider appears, and they are prompted to try again. Problems include linear graphs, table of values, equations, and stories. Thi
Grades:
7th - 9th
Types:
CCSS:
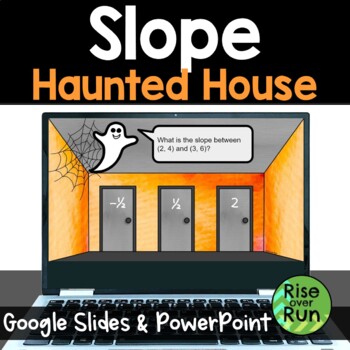
Slope Digital Math Escape Room Activity for Halloween
Students will love this fun practice activity for calculating slope between 2 points. Answering correctly will help them escape a haunted house! Includes Google Slides and PowerPoint versions. They are given 14 problems to solve, choosing from 3 possible answers for each one. If they solve correctly, they will choose the correct door and avoid the scary giant spiders! If they make a mistake, a spider appears, and they are prompted to try again. For each problem, students are given two ordere
Grades:
7th - 9th
Types:
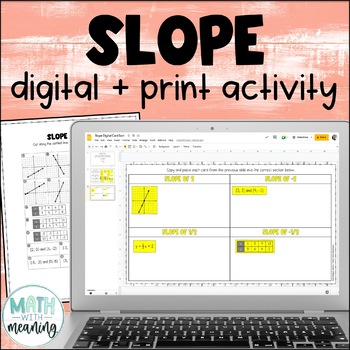
Finding Slope from Graphs, Tables, Equations, and Points Digital Card Sort
Looking for an engaging, no-prep activity to practice finding the slope when given a graph, equation, table, or two points? Students will sort 22 cards based on their slope in this fun digital and print card sort activity.Each problem gives either a table, a graph, two points, or an equation in slope-intercept form and asks students to find the slope. Please view the preview file to make sure that this resource is appropriate for your students.This product includes the following:A link to the ac
Grades:
6th - 9th
Also included in: Middle School Math Digital and Print Activity Bundle Volume 3
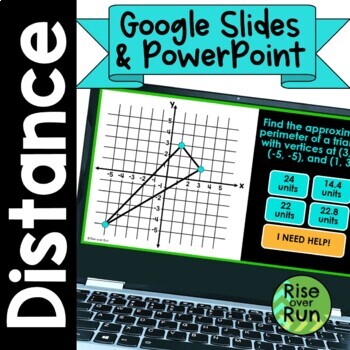
Distance Between 2 Points Practice PowerPoint & Google Slides
Students use the Pythagorean Theorem to find distances between points on a coordinate grid in this no-prep, self-checking activity. Four types of problems are included:Distance between 2 points on a graphDistance between 2 points sketched (for large numbers)Perimeter of polygons on a graphReal world map application problemsSolutions are in the format of whole numbers, decimals, roots, and rounded approximations. Problems range from very basic to challenging!16 problems are included. Each one is
Grades:
8th - 10th
Types:
Also included in: 8th Grade Geometry Unit Activities and Lessons
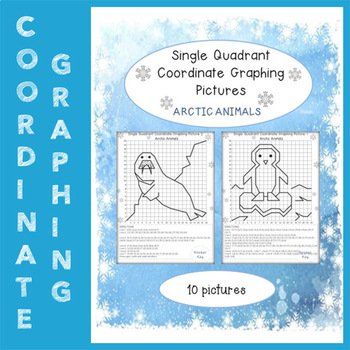
Arctic Animals. Have Fun with Mystery Pictures! -Single Quadrant Coordinate Pics
(Single Quadrant Coordinate Graphing Pictures)10 mystery pictures!Arctic animals included:- Walrus - Blue whale- Arctic fox- Polar bear- Arctic owl- Arctic hare- Puffin- Caribou- Orca- Penguin (Penguins DO NOT live in the Arctic. They actually live in the Antarctic. But I decided to include them as well).A completed answer key page for every picture is included.All points are represented by positive whole numbers, there are no fractions or decimals. Great activity for anytime of the year!
Subjects:
Grades:
1st - 9th
Types:
Digital Mad Lib Math Activity - Identify Slope and Y-Intercept from a Graph
No prep. No paper. No materials. Totally digital. Great for Distance Education, 1:1, BYOD, or math computer centers. Google Drive, Google Classroom, and Microsoft One Drive.Students look at a graph and determine the slope and the y-intercept.This is an interactive, digital mad lib for math. Students work through 15 slides. Each slide consists of a problem and four possible choices. Students select their answers and then type them into the appropriate spaces on the last slide. The answers will cr
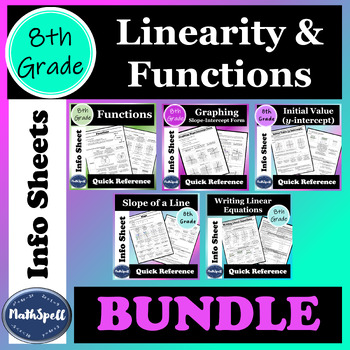
Linearity & Functions | Quick Reference Sheets | 8th Grade Math Review | BUNDLE
Great way to help students quickly review linearity and functions! These 8th Grade Math Cheat Sheets can be used for students to review concepts they've already learned (great for end of year reviews), or as complete notes pages to help teach the concepts. These sheets are also helpful for parents and substitute teachers as a way to refresh their memory of a concept so they're better able to help students.More 8th Grade Math Reference Sheets available in my store as a larger BUNDLE (for a discou
Grades:
8th - 9th
Types:
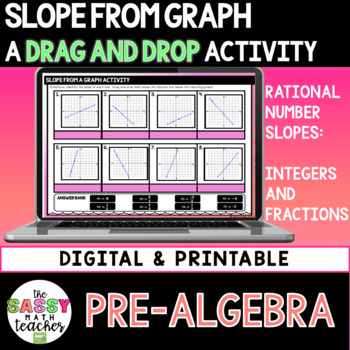
Finding Slope From A Graph
Finding Slope From Graph Digital ActivityStudents will practice finding slope from a total of 8 graphs! Consists of 6 lines with provided points and 2 graphs without. Topics Included:Positive and Negative SlopesRational Number SlopesThis product includes the following:Student DirectionsTeacher directionsPrintable Version of the Slope from a Graph worksheet Digital Version of the Slope from Graph Worksheet ⭐️ Includes a PowerPoint file and link to make a copy in Google SlidesDeta
Grades:
8th - 9th
Types:
Graph paper: 14 x 19 boxes with a full page grid, half-inch squares, and no name
You'll never again run out of graph paper! Print grid paper with this item for use in science, math, and other educational applications.
Subjects:
Grades:
9th - 12th, Higher Education, Adult Education, Staff
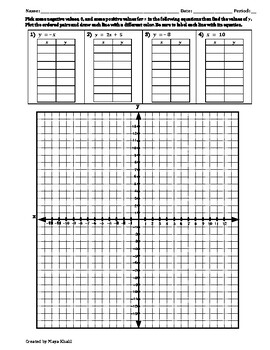
Graphing Linear Equations with Tables of Values Worksheet II
Students pick values of x and use tables of values to graph equations. The resource above shows the answer key.
Grades:
6th - 9th
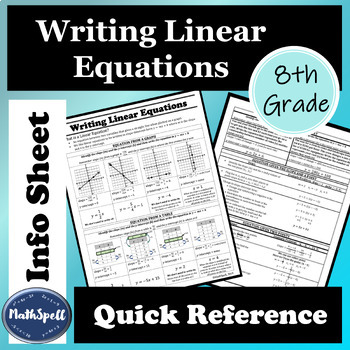
Writing Linear Equations | 8th Grade Math Quick Reference Sheet | Cheat Sheet
This quick reference sheet explains and shows examples for how to write linear equations given:A graphA tableA contextThe slope and a pointTwo pointsThis can be used for students to review Writing Linear Equations after they've already learned it or as an already complete notes page to help teach the concept. It is also a great resource to give to parents at the beginning of the unit as a way for them to refresh their memory of the concept so they're better able to help their student.More 8th Gr
Grades:
8th - 9th
Types:
CCSS:
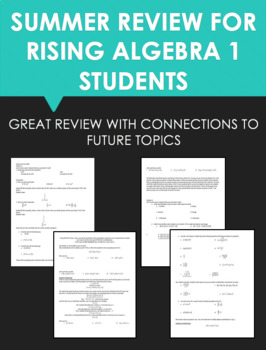
Summer Review for Upcoming Algebra 1 Students
This packet is a review of topics for students who will be entering Algebra 1. Each section is a review of what was covered over this past year. At the end of each section is a preview portion. Each preview portion is a sneak peek and does not cover the full amount of that topic that they will learn and practice in Alg. 1. It does shows how the topics that they have learned will be built upon in Alg. 1. This preview portion has examples for the student to attempt so that they can get used to the
Subjects:
Grades:
6th - 10th
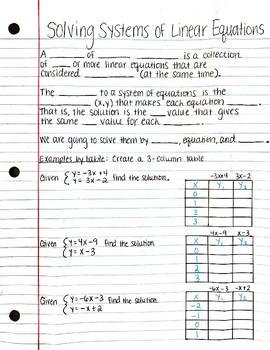
Solving Systems of Linear Equations Guided Notes
These are extremely helpful with my SpEd kiddos that receive note taking assistance. It allows them to keep up with the rest of the class and not have to worry about getting behind because they are trying to copy everything down.
This is also helpful to post on my classroom website for parents to understand concepts and help students at home.
Includes: How to solve systems of equations by table, setting the equations equal to each other, and finding the intersecting point on a graph.
Grades:
7th - 9th
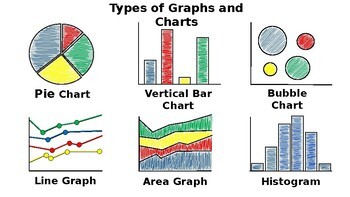
Types of Graphs and Charts - Science Journal Illustration
This is a step by step illustration of each of the 12 types graphs and charts that can be created using Microsoft Excel/Google Sheets. This can be used as an introduction to any Microsoft Excel/Google Sheets Graph and Charts lesson plan. Students use 2 pieces of blank paper and colored pencils to build background knowledge of the types of graphs and charts able to be utilized by entering data on an Excel/Google Spreadsheet and transforming the data into visual representations.

Octobre Coloring Halloween -Preschool -coloring Worksheets for kids pdf
Title:Coloring Halloween for Kids: Exclusive 14 Fun PagesIntroduction:Welcome to a world of imaginative fun with our exclusive "Coloring Halloween for Kids" book. With 14 spine-tingling designs on 14 engaging pages, this coloring book brings the magic of Halloween to life, providing hours of creativity and entertainment for young artists.Highlight Features:14 Spooky Designs: Each page features a unique Halloween-themed illustration.Imaginative and Educational: Blend creativity with learning abou
Subjects:
Grades:
PreK - 12th, Higher Education, Adult Education, Staff
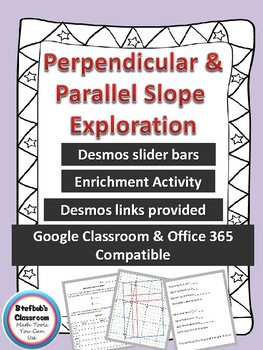
Parallel and Perpendicular Slope Exploration
Perpendicular and Parallel Slope Exploration gives students a chance to discover the relationship of slopes of parallel and perpendicular lines. They will use Desmos slider bar tools to do so. (Click here to see an example of how slider bars work.) Students will record their discovered parallel and perpendicular equations in tables. The tables are followed by leading questions about slope relationships and check for understanding problems. To conclude the activity, teachers can provide students
Grades:
9th - 10th
Types:
CCSS:
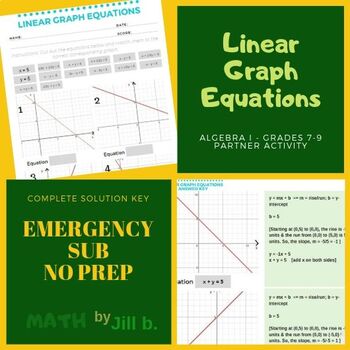
Linear Equation Graphs Algebra I Partner Activity
The objective of this activity is to show how changing the signs and the coefficients in a linear equation changes the line on a graph. Students may wish to work with a partner to match the given equations up to the given graphs. Equations are written in standard notation for extra practice in balancing equations.Students should know how to derive the slope-intercept form from the graph and match it to the correct equation. Includes a total of 14 graphs and an answer key with solutions.*********
Grades:
7th - 10th
Types:
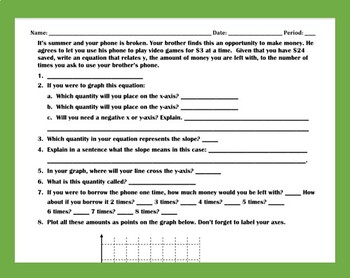
Bundle - Applications: Writing & Graphing Slope-Intercept Equations I, II, & III
This is a bundle for: Applications for Writing and Graphing Slope-Intercept Equations I Applications for Writing and Graphing Slope-Intercept Equations II. Applications for Writing and Graphing Slope-Intercept Equations III.
Grades:
8th - 11th
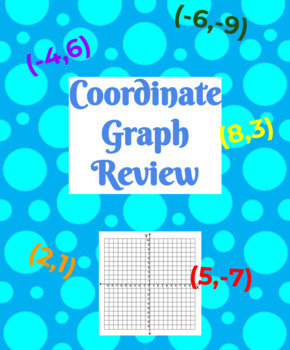
Review of Coordinate Planes
This lesson is usually the start of graphing linear equations. A quick reminder of how to use coordinate graphs. I have the students create a foldable with this information to refer back to. The foldable is coming soon. There is also an accompanying worksheet for this unit that is coming soon.
Grades:
7th - 9th
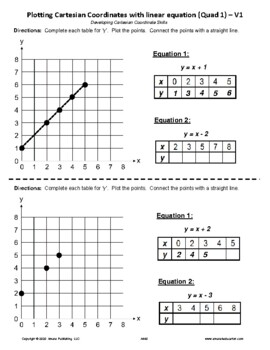
Cartesian Coordinates - Plotting a line given (x,y) coordinates - Q1 Only - FREE
Cartesian Coordinate practice - plotting a line (linear) given the equation and the plot - quadrant 1 only. Note: I used only Q1 and positive slopes, so the students would not confuse the process. Connect line after rectangular (x,y) coordinates have been plotted. Introductory lesson exposure. Good luck with your students. FREE. Blaine Helwig
Grades:
5th - 10th
Showing 1-24 of 38 results


