123 results
Middle school statistics resources for Microsoft PowerPoint $5-10
Mean, Median, Mode, and Range (Bundled Unit) - Distance Learning
This is an enjoyable, interactive, and engaging bundled unit covering mean, median, mode, and range (and introduces outliers). This unit is great for 5th and 6th graders and 7th graders who struggle with these concepts.Included in this bundled unit:PowerPointAnimated and fun 4-part, 21-slide PowerPoint (multi-day use)-Part 1 – The Meaning of Mean-Part 2 – Getting in the Middle of Median-Part 3 – Making the Most of Mode-Part 4 – Home, Home on the RangeEach section offers plenty of practice probl
Subjects:
Grades:
5th - 7th
Geometry: Survey and Circle Graph Project Made Fun!
Circle Graph Geometry Activity - Everyone just wants their piece of the pie!This is a fun, multi-faceted project that will have your students creating and implementing a survey, converting their results using various mathematical operations, and creating a poster-sized circle graph incorporating various geometry skills.This Survey and Circle Graph Project Unit Includes:PowerPoint:-Fun, interactive, 3-part PowerPoint slide presentation that walks you and your students through the entire project f
Subjects:
Grades:
5th - 7th
Probability - Tree Diagrams for independent and dependent events
To save you some time when you are preparing your lessons on dependent and independent events, I have collected a bunch of problems that can be solve by drawing tree diagrams and made a slide show of the questions and there answers. The tree diagrams are animated to enable you to explain as you go on. They can also be adjusted very easily and quickly to fit any other problems that you want you learners to solve.There are 6 examples of dependent events and 9 of independent events. I have also inc
Subjects:
Grades:
7th - 12th
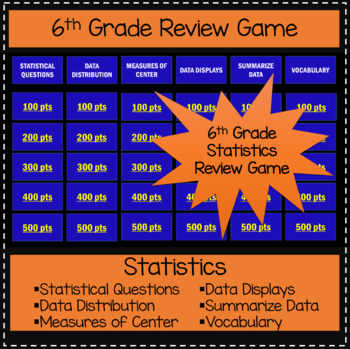
6th Grade Statistics - Game Show Review Game
This is the perfect way to review your 6th grade statistics unit!Students will love this Jeopardy-like game to review the Statistics standards. This game is aligned with Common Core standards. Categories include STATISTICAL QUESTIONS, DATA DISTRIBUTION, MEASURES OF CENTER, DATA DISPLAYS, SUMAMRIZE DATA, AND VOCABULARY. Points range from 100 - 500, which reflect the increase in difficulty from 100-point basic review questions to 500-point questions that require students to apply their knowledge.*
Subjects:
Grades:
5th - 7th
Also included in: 6th Grade Game Show Review Games BUNDLE
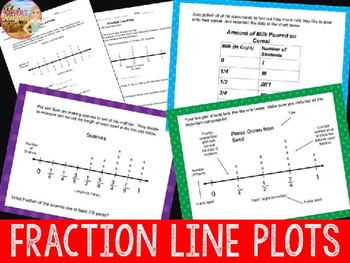
Fraction Line Plots Unit
Fraction Line Plots are easy to teach with this unit. Students will interpret line plots with addition and subtraction with these slides and accompanying worksheets.Students will evaluate ready-made fraction line plot data as well as learn how to make their own graphs from a given set of fraction data.Materials Included- Data Analysis Vocabulary Slide- 7 Interpreting Data Graphs (35 slides)- 3 Charts for Creating Graphs (10 slides)- 9 Student Sheets- Post-Test- Answer KeyNo-Prep SetupFor each se
Subjects:
Grades:
5th - 6th
CCSS:
Gráficas - Estadística
Gráficas - Estadística - Analizar DatosEste recurso trabaja los siguientes temas:Gráficas: Representa, Interpreta y Compara•Recopilar y Organizar Datos •Tabla de Frecuencias•Gráfica de Barras•Gráfica Circular•Gráfica Pictórica•Gráfica Lineal•Tabla de Tallo y Hojas•Diagrama de PuntosEl recurso incluye:•Presentación en PowerPoint y PDF - 55 diapositivas con explicaciones y ejemplos•8 hojas de trabajo - Incluye la clave de respuestas•3 hojas de trabajo - Proyecto - Encuesta y analiza los res
Subjects:
Grades:
4th - 6th
Probabilidad - Eventos Simples y Compuestos - Diagrama de Árbol
Probabilidad - Eventos Simples y Compuestos - Diagrama de ÁrbolEste recurso trabaja los siguientes temas:Eventos simplesProbabilidadResultados favorables Resultados posibles Espacio muestralEventos posibles, seguros o imposibles Hallar la probabilidad de eventos simplesEventos compuestos independientesRegla de multiplicaciónDiagrama de árbol y probabilidadEl recurso incluye:•Presentación en PowerPoint y PDF - 64 diapositivas con explicaciones y ejemplos•5 hojas de trabajo - Incluye la clave de r
Subjects:
Grades:
5th - 7th
Statistics and Probability Practice Problems (MSM)
If you are looking for extra practice problems for statistics and probability standards within 6th grade math, you are in the right place! You will be getting a google slideshow for each standard under statistics and probability that have multiple practice problems, using peardeck. The slides can also be modified to be conducted by the teacher without using the peardeck extension by simply deleting the peardeck attachments. The answers for each problem are in the speaker notes on each slide.*All
Subjects:
Grades:
6th
Also included in: 6th Grade Math Standards-Based Practice Problems
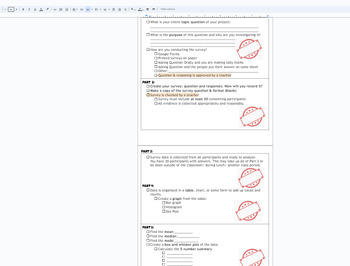
Statistics Survey project Discovery (broken down into sections) with Rubric
This is a broken down (scaffolded) packet of instructions/ guide for a Stats Project for Math 1 HS or 8th grade students. The goal of the project is for students to take a statistical survey on quantitative data (numbers) of their choice. Using this data from the survey, the following will be included in the project:Survey- the question being askedSurvey responses (requirement of 30)Data organization: Bar chart, Histogram, Dot PlotMeanMedianModeBox and Whisket Plot5 number summary (Q1,Q2,Q3, min
Subjects:
Grades:
7th - 12th, Higher Education, Adult Education
CCSS:
Math 6, Topic 8: Statistics: Analyzing Data Complete Lesson Plan
Engage and energize your students with a dynamic lesson plan unveiling the wonders of Math 6, Topic 8: Statistics: Analyzing Data! This vibrant presentation comprises 118 animated and illustrated slides, delivering a captivating learning experience. Dive into a multitude of classroom exercises that bring the below topics and objectives to life. Get ready for an interactive journey that transforms abstract concepts into tangible understanding!Topic ObjectivesSection 8-1: Line PlotsUnderstand the
Subjects:
Grades:
6th - 7th

Statistics animated powerpoint template lesson part 1
Statistics animated lesson:content:1.Introduction2.Discrete Data3.Continuous Data4.Central Tendancy of a Data Set
Subjects:
Grades:
8th - 9th
Also included in: Statistics animated powerpoint lesson template
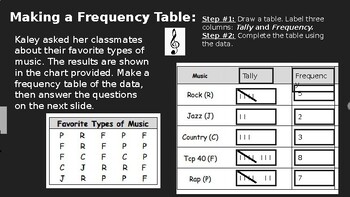
Frequency Tables and Histograms Assignment/Practice Questions
This is a PowerPoint that can be used as practice problems (classwork or homework) to help understand data through frequency tables and histograms. These notes align with the EnVisions Math textbook for topic 8, lesson 4 but can be used separately as well! (Delete the yellow "answer key" clip art along with any answers on each slide before assigning students their copy!) Document can be downloaded and edited as needed.
Subjects:
Grades:
5th - 8th
Types:

Bundle: Mean, Median, Mode, & Range
This is the bundled set for mean, median, mode, and range. Besides the PowerPoint lesson, it also includes the set of 45 task cards. As a bonus, the bundle includes interactive notebook entries to further review and practice.(If you purchase this bundle, please don't purchase individual items.)
Subjects:
Grades:
6th - 7th

Statistics animated powerpoint lesson template part 2
Statistics part 2:1.Range and Interquartile Range2.Box and Whisker Plot
Subjects:
Grades:
8th - 9th
Also included in: Statistics animated powerpoint lesson template

Halloween Math Powerpoint Quiz - FUN CLASS ACTIVITY
A fully animated Halloween maths quiz with sound. Updated 2016.. This is a quiz for teams of children working together solving problems. Order pumpkins by weight; work out how many frogs and spiders are in the cauldron; match the ghostly frames using enlargement; calculate mean, median, mode and range to compare pumpkin patches; and finally go trick or treating using factors, primes and multiples. Click the drop down pumpkin to return to the score sheet. Click the witch to move to next slide.The
Subjects:
Grades:
4th - 7th
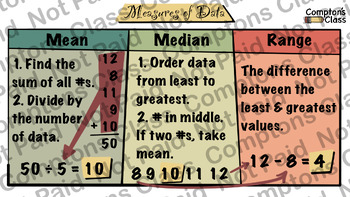
Compton's Class Data And Statistics 6th Grade Math Package
5 Anchor Charts that deals with Data and Statistics.
Subjects:
Grades:
6th
FRENCH MATHS | SANS CAHIER/PAPERLESS | DIAGRAMMES/CHARTS | REPRESENTATION
Having trouble visualizing how to "break down" math concepts and how to structure your teaching? New to this grade level or unfamiliar with "how" to teach it? Tired of passing out worksheets? If you're wanting to try something else to see if your students become more engaged and confident in math... Look no further. No book? No problem. Printer broken? No problem. Multi-levelled or split classrooms? No problem.Imagine math classes that require zero prep, zero paper, zero planning, and slides whi
Subjects:
Grades:
5th - 7th
Probability Activity Bundle with Presentation TaskCards and Activity
This versatile and engaging bundle on probability allows you to teach the concept, reinforce it, and then have students practice their skills with great visual and kinesthetic activities. Covering probability, outcomes, and events, as well as simple probability methods involving coins, cards, dice, spinners, marbles, and words, these tasks will get your students thinking, evaluating, and discussing this statistical concept.Save 25% with this money saving bundle or buy the Probability Task Cards
Subjects:
Grades:
6th - 8th
Presidential Data Analyst Math Project | Excel | Presentations | Presidents Day
Elevate your Presidents' Day lesson plans with this comprehensive Presidential Data Analysis Math Project, designed to engage students in a deep exploration of U.S. presidential history through mathematical analysis. This invaluable resource provides educators with everything they need to guide their students through a dynamic and informative project that combines historical research with mathematical concepts.**Key Features:**1. **Thematic Relevance:** - Aligned with Presidents' Day, this o
Subjects:
Grades:
7th - 10th
Counting Principle, Permutation, Combination Word Problems (Close Reading)
I've used these lessons for roughly twenty years with great success! Of course, I have made adjustments and improvements along the along the way and am passing the current version along to you. Math teachers can easily teach valuable close reading and problem solving skills to improve math literacy with these materials.
Solving word problems involving counting principle, permutation, and combination can be difficult for students because of the close reading that is necessary. Analyzing the
Subjects:
Grades:
8th - 11th, Higher Education
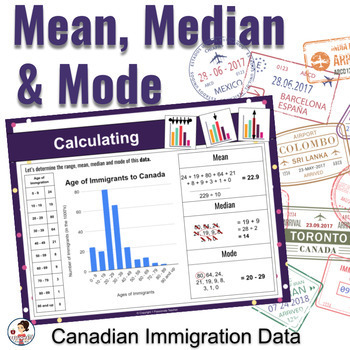
Mean Median and Mode Data Management Set: Grade 5 New Math Ontario Curriculum
How am I ever going to get all of this covered and when will I have time to plan it all? If you have ever found yourself asking this question, then this measures of central tendency meets Canadian Immigration (Social Studies) lesson and activity set is for you. Cover calculating, analyzing, and comparing, along with Canadian immigration trends using real-world data.This set is perfect for anyone who:is ready to be done with planningdoesn't have enough time to cover all of the expectations is lo
Subjects:
Grades:
5th - 6th

WHO'S YOUR DADDY? Corn Genetics Unit WITH Guided Inquiry Lab
50 PAGE Mendelian Genetics Unit with a Guided Inquiry Lab using an optional Chi-Squared Statistical Test.
This can be done as a lab or can just be used as a PowerPoint presentation on Genetics and/or Meiosis.
THIS LAB IS BEST USING THE REAL EARS OF CORN BUT CAN BE DONE WITH THE PHOTOS AT THE END. CORN EARS CAN BE OBTAINED FROM BIOLOGICAL SUPPLY COMPANIES OR YOUR GARDEN. :)
This lab covers the following concepts:
1. Corn Genetics, Monohybrids and Dihybrids
2. Corn (Plant) Reproduction (Ani
Subjects:
Grades:
7th - 12th, Higher Education, Adult Education
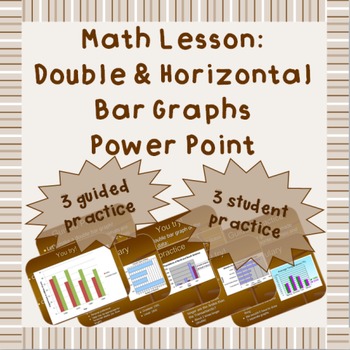
Double bar graphs, horizontal bar graphs Power Point
Incorporate technology into your lesson with this PowerPoint!
This presentation is an ideal double bar graph and horizontal bar graph review for students. This allows students to analyze given graphs as well as practice drawing double bar- and horizontal bar-graphs.
This is NOT a CCSS-aligned lesson; this should be a supplement to a CCSS-aligned lesson.
This is NOT a unit, homework assignment, or assessment.
This is in .ppsx (2010 Power Point Show) format. If you would prefer an editable v
Subjects:
Grades:
6th - 8th
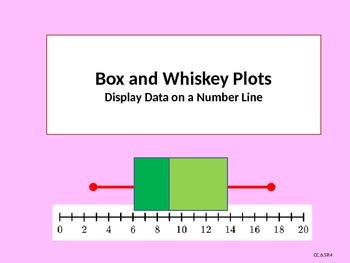
Box and Whisker Plots with Student Worksheet
Box and Whisker Plots with Student Worksheet is an introductory PowerPoint presentation teaching students what a Box and Whisker Plot is and how it can be used with data.
Students will learn how to make a Box Plot. Find the Median, (Q2) the Lower or First Quartile (Q1) and Upper or Third Quartile (Q3).
Bright colors and animation hold attention. Great for whole class or small group intervention. Differentiated instruction and visual representation for the Special Education students or visua
Subjects:
Grades:
5th - 7th
CCSS:
Showing 1-24 of 123 results


