53 results
Middle school statistics interactive whiteboards $5-10
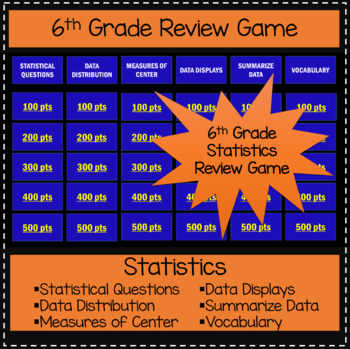
6th Grade Statistics - Game Show Review Game
This is the perfect way to review your 6th grade statistics unit!Students will love this Jeopardy-like game to review the Statistics standards. This game is aligned with Common Core standards. Categories include STATISTICAL QUESTIONS, DATA DISTRIBUTION, MEASURES OF CENTER, DATA DISPLAYS, SUMAMRIZE DATA, AND VOCABULARY. Points range from 100 - 500, which reflect the increase in difficulty from 100-point basic review questions to 500-point questions that require students to apply their knowledge.*
Subjects:
Grades:
5th - 7th
Also included in: 6th Grade Game Show Review Games BUNDLE
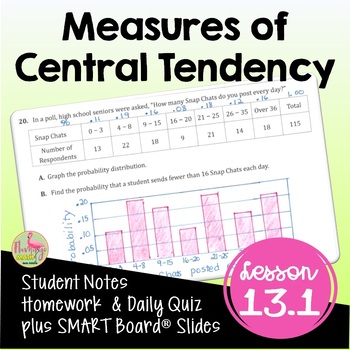
Measures of Central Tendency (Algebra 2 - Unit 13)
Measures of Central Tendency Algebra 2 Lesson:Your Pre-AP Algebra 2 Honors students will draw, analyze and interpret box-and-whisker plots, find outliers, and calculate measures of central tendency in this unit 13 lesson on Data Analysis & Statistics that cover the concepts in depth. #distancelearningtptWhat is included in this resource?⭐ Guided Student Notes⭐ Google Slides®⭐ Fully-editable SMART Board® Slides⭐ Homework/Practice assignment⭐ Lesson Warm-Up (or exit ticket)⭐Daily Content Quiz
Subjects:
Grades:
8th - 11th, Higher Education
CCSS:
Also included in: Algebra 2 Curriculum Mega Bundle | Flamingo Math
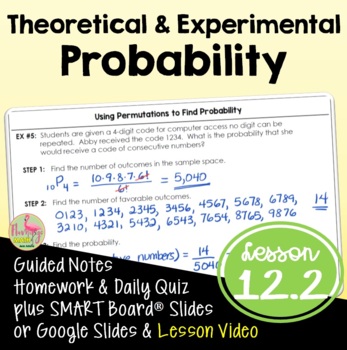
Theoretical and Experimental Probability (Algebra 2 - Unit 12)
Theoretical & Experimental Probability Algebra 2 Lesson:Your Pre-AP Algebra 2 Honors students will find both experimental and theoretical probabilities in this Unit 12 lesson. #distancelearningtptWhat is included in this resource?⭐ Guided Student Notes⭐ Google Slides®⭐ Fully-editable SMART Board® Slides⭐ Homework/Practice assignment⭐ Lesson Warm-Up (or exit ticket)⭐ Daily Content Quiz (homework check)⭐ Video Lesson Link for Distance Learning - Flipped Classroom models⭐ Full solution setStude
Subjects:
Grades:
8th - 11th, Higher Education
CCSS:
Also included in: Algebra 2 Curriculum Mega Bundle | Flamingo Math
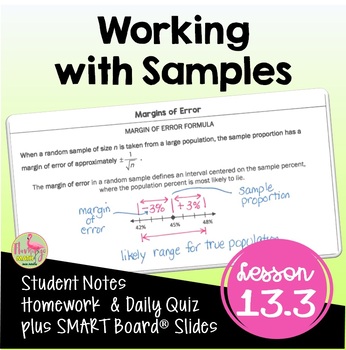
Working with Samples (Algebra 2 - Unit 13)
Working with Samples Algebra 2 Lesson:Your Pre-AP Algebra 2 Honors students will find draw, analyze and interpret box-and-whisker plots, find outliers, and calculate measures of central tendency in this unit 13 lesson on Data Analysis & Statistics that cover the concepts in depth. #distancelearningtptWhat is included in this resource?⭐ Guided Student Notes⭐ Google Slides®⭐ Fully-editable SMART Board® Slides⭐ Homework/Practice assignment⭐ Lesson Warm-Up (or exit ticket)⭐Daily Content Quiz (ho
Subjects:
Grades:
8th - 11th, Higher Education
CCSS:
Also included in: Algebra 2 Curriculum Mega Bundle | Flamingo Math
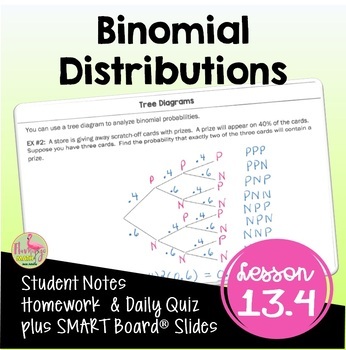
Binomial Distributions (Algebra 2 - Unit 13)
Binomial Distributions Algebra 2 Lesson:Your Pre-AP Algebra 2 Honors students will calculate measures of central tendency, draw, analyze, and interpret box-and-whisker plots and find outliers using binomial distributions in this Unit 13 lesson. #distancelearningtptWhat is included in this resource?⭐ Guided Student Notes⭐ Google Slides®⭐ Fully-editable SMART Board® Slides⭐ Homework/Practice assignment⭐ Lesson Warm-Up (or exit ticket)⭐ Daily Content Quiz (homework check)⭐ Video Lesson Link for Dis
Subjects:
Grades:
8th - 11th, Higher Education
CCSS:
Also included in: Algebra 2 Curriculum Mega Bundle | Flamingo Math

Statistics animated powerpoint template lesson part 1
Statistics animated lesson:content:1.Introduction2.Discrete Data3.Continuous Data4.Central Tendancy of a Data Set
Subjects:
Grades:
8th - 9th
Also included in: Statistics animated powerpoint lesson template

Statistics animated powerpoint lesson template part 2
Statistics part 2:1.Range and Interquartile Range2.Box and Whisker Plot
Subjects:
Grades:
8th - 9th
Also included in: Statistics animated powerpoint lesson template

Halloween Math Powerpoint Quiz - FUN CLASS ACTIVITY
A fully animated Halloween maths quiz with sound. Updated 2016.. This is a quiz for teams of children working together solving problems. Order pumpkins by weight; work out how many frogs and spiders are in the cauldron; match the ghostly frames using enlargement; calculate mean, median, mode and range to compare pumpkin patches; and finally go trick or treating using factors, primes and multiples. Click the drop down pumpkin to return to the score sheet. Click the witch to move to next slide.The
Subjects:
Grades:
4th - 7th
FRENCH MATHS | SANS CAHIER/PAPERLESS | DIAGRAMMES/CHARTS | REPRESENTATION
Having trouble visualizing how to "break down" math concepts and how to structure your teaching? New to this grade level or unfamiliar with "how" to teach it? Tired of passing out worksheets? If you're wanting to try something else to see if your students become more engaged and confident in math... Look no further. No book? No problem. Printer broken? No problem. Multi-levelled or split classrooms? No problem.Imagine math classes that require zero prep, zero paper, zero planning, and slides whi
Subjects:
Grades:
5th - 7th
Linear Regression and the Correlation Coefficient (Math 1)
This lesson is the fifth of six lessons in the Math 1 Statistics Unit.
This lesson includes important vocabulary, examples (guided practice), and class work (independent practice). At the end of the presentation is a Ticket Out the Door that can be used as a formative assessment.
There is a note-taking guide for the students to fill out as the teacher goes through a SMART Notebook presentation.
Unit 1: Statistics
Lesson 1: Mean Median Mode Range Outliers and Skew
Lesson 2: Box and Whisker
Subjects:
Grades:
6th - 12th
CCSS:
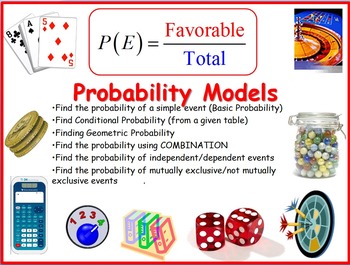
Probability Models
This handout drills the understanding of the different models of probability. Student would have to first determine under which model should this problem fit, then, apply the appropriate strategy to answer the questions. There are many ways to answer each of the questions provided in this handout. I provided "An" answer key.
In this handout, you will find a set of 40 questions on the following probability models:
1. Detailed visual description of the Standard Deck of Cards
2. Basic Probab
Subjects:
Grades:
6th - 12th, Higher Education, Adult Education, Staff
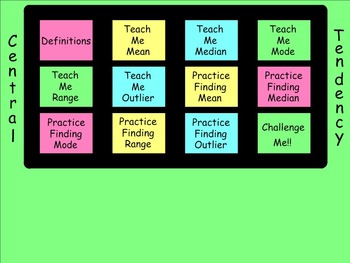
How I Teach Finding Mean, Median, Mode, Range, and Outliers
This is a 70 page Smartboard file covering Central Tendency. The students are given definitions for Mean, Median, Mode, Range, and Outlier. They are also taught how to find each when given a list of numbers. There are plenty of practice pages for each and all include answers. There is also a section of more challenging problems at the end. All pages are linked to a central homepage so that no matter where you are in the file it will always be easy to navigate around.
Subjects:
Grades:
6th - 9th
Types:

Jeopardy - Probability
This is a fun and interactive Jeopardy game I created with Smart Notebook to use as a review tool for probability with fractions with my students.
There are 25 questions, with the difficulty of questions increasing with the higher point questions. Questions include rolling dice probability, spinner probability, playing card probability, word problems, and much more.
When a question is asked, click on the value and the question will appear. When the student or team answers the question, cli
Subjects:
Grades:
4th - 6th
Types:
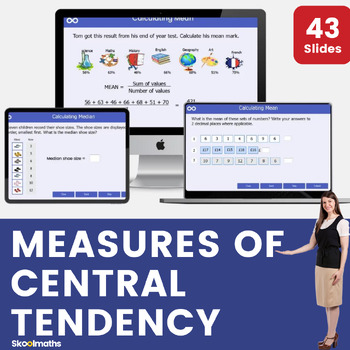
Measures of Center - Mean, Median, Mode and Range Interactive Math Lesson
Measures of Center - Mean, Median, Mode and Range Interactive Math LessonA completely interactive Middle school lesson for pupils in 6th grade on calculating averages. In this lesson, learners are able tocalculate measures of central tendency (mean, median, and mode);calculate measures of dispersion (range)understand interpretation and applicability of these measuresapply appropriate use of measures to compare data.The lesson can be used as whole class teaching by teachers and at home by learner
Subjects:
Grades:
6th - 7th
Also included in: Complete Statistics and Probability Bundle | Digital and Print
Correlation vs Causation (Math 1)
This lesson is the fourth of six lessons in the Math 1 Statistics Unit.
This lesson includes important vocabulary, examples (guided practice), and class work (independent practice). At the end of the presentation is a Ticket Out the Door for the students.
There is a note-taking guide for the students to fill out as the teacher goes through a SMART Notebook presentation.
Unit 1: Statistics
Lesson 1: Mean Median Mode Range Outliers and Skew
Lesson 2: Box and Whisker Plots
Lesson 3: Standard
Subjects:
Grades:
6th - 12th
CCSS:
Mean Median Mode Range Outliers and Skew (Math 1)
This lesson is the first of six lessons in the Math 1 Statistics Unit.
This lesson includes important vocabulary, examples (guided practice), and class work (independent practice). The examples and class work are broken up in to two separate "chunks". This allows the students to establish a foundation for the topics covered before moving on to more challenging problems. At the end of the presentation is a Ticket Out the Door that can be used as a formative assessment.
There is a note-taking g
Subjects:
Grades:
6th - 12th
CCSS:
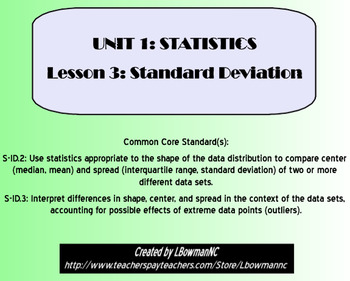
Standard Deviation (Math 1)
This lesson is the third of six lessons in the Math 1 Statistics Unit.
This lesson includes important vocabulary, examples (guided practice), and class work (independent practice). The examples and class work are broken up in to two separate "chunks". The first chunk requires the students to calculate the standard deviation by hand. The second chunk requires the students to find the standard deviation using a graphing calculator and then to use standard deviation to compare different sets of d
Subjects:
Grades:
6th - 12th
CCSS:
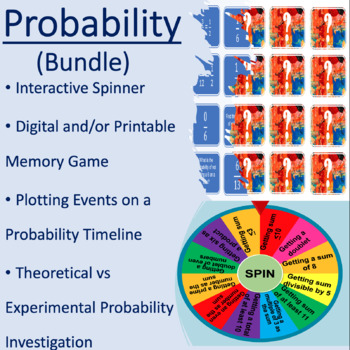
Probability:Interactive Games,Events on Number line,Theoretical and Experimental
By purchasing this bundle, you will save 10% off the individual resources! Plotting events on a probability timeline and relating fractions to likelihood:This product includes:+ Plotting events on a probability timeline (Three versions include: Interactive PowerPointä, Cut and paste, and Draw a Line)+ Fun and interactive matching memory game for probability (chances of events happening)+ Printable matching memory game for probability + Post-test (probability reflection questions) Investigate the
Subjects:
Grades:
5th - 6th
Line Plots and Data Distribution Interactive Presentation - 6.SP.2
Interactive Powerpoint presents analyzing data distribution using line plots and data landmarks. The lesson moves step by step through the material in a way that will keep students interested and provide a basis for future learning. Use with smartboard, projector, computer, pad or as printables. Great lesson for cooperative learning or centers.
Objectives:
- Recognize line plots
- Answer statistical questions using line plot data
- Recognize and identify data landmarks on line plots
- Understan
Subjects:
Grades:
5th - 8th
CCSS:
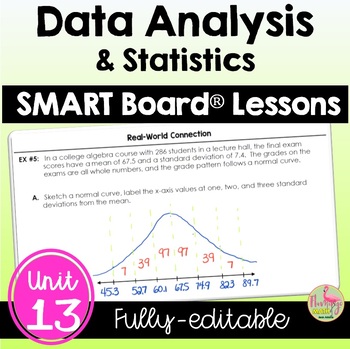
Data Analysis and Statistics SMART Board® Lessons (Algebra 2 - Unit 13)
Data Analysis & Statistics SMART Board Bundle:This bundle of SMART Board® presentations for Algebra 2 Honors students covers Unit 13: DATA ANALYSIS & STATISTICS. You have total freedom to alter and revise each fully-editable SMART Notebook® file. Then, you can teach and present your lesson with any compatible Interactive Whiteboard. There are 108 slides to cover the concepts in depth.The unit includes the following topics:1) Measures of Central Tendency2) Analyzing Data3) Working With S
Subjects:
Grades:
8th - 11th, Higher Education
CCSS:
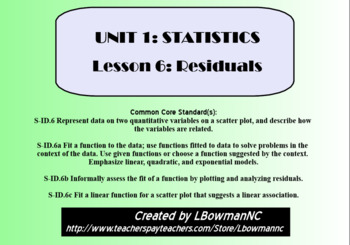
Residuals (Math 1)
This lesson is the last of six lessons in the Math 1 Statistics Unit.
This lesson includes important vocabulary, examples (guided practice), and class work (independent practice) on how to find the residual values for a linear regression model. At the end of the presentation is a Ticket Out the Door for the students.
There is a note-taking guide for the students to fill out as the teacher goes through a SMART Notebook presentation.
Unit 1: Statistics
Lesson 1: Mean Median Mode Range Outli
Subjects:
Grades:
6th - 12th
CCSS:
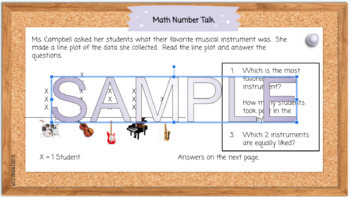
Line Plot Number Talks: Probability and Statistics
Number Talks are a great way to facilitate student interaction in all units of mathematics. Excellently crafted to review skills and review / practice questions. Includes slides for discussion of strategies and all answers provided! The following VA Standards of Learning are met in these slides: 5.15 The student will determine the probability of an outcome by constructing a sample space or using the Fundamental (Basic) Counting Principle. 5. 16 The student, given a practical problem, will a)
Subjects:
Grades:
4th - 6th
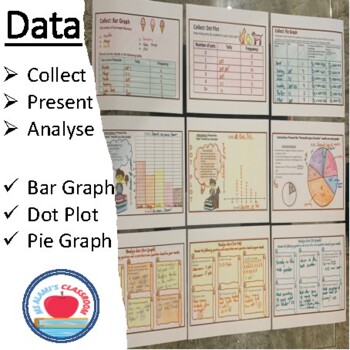
Data + Collect. Present. Analyse + Bar Graph. Dot Plot. Pie Graph.
Looking for a sequenced resource to review data analysis/ interpretation with your students? This hands-on resource structures students understanding of data collection, presentation, and analysis. Firstly, students will revise the key terminology of data analysis including range, minimum & maximum, mean, median, mode by playing with the interactive spinner. Students will tap on the digital spinner and will be required to tap again for the spinner to land on a random data analysis question.
Subjects:
Grades:
5th - 6th
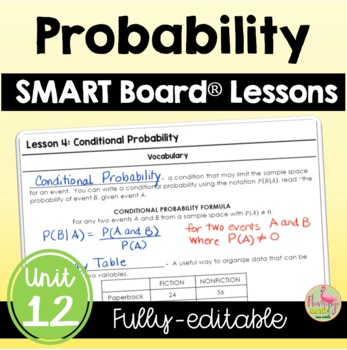
Probability SMART Board® Lessons (Algebra 2 - Unit 12)
This bundle of SMART Board® presentations for Algebra 2 Honors students covers Unit 12: PROBABILITY. You have total freedom to alter and revise each fully-editable SMART Notebook® file. Then, you can teach and present your lesson with any compatible Interactive Whiteboard. There are 82 slides to cover the concepts in depth.***(6/28/2022) Updated and revised.The unit includes the following topics:1) Permutations and Combinations2) Theoretical and Experimental Probability3) Independent and Depende
Subjects:
Grades:
8th - 11th, Higher Education
CCSS:
Showing 1-24 of 53 results


