107 results
8th grade critical thinking statistics resources for Microsoft Excel

My Dream Car: A Microsoft Excel Project
I found that my students really enjoyed doing this Excel project in Computer Applications. Students will use Excel and its capabilities, to apply formulas and charts to a subject which they find fun and interesting, their dream car. They will choose several cars and will then do a cost analysis of their selected cars. To do this project, they have to select several cars, find cost and fuel economy information on those cars, download pictures of the cars and use Excel to do a cost analysis.
Grades:
7th - 12th
Types:
Also included in: Microsoft EXCEL Activities - 6 PROJECTS!
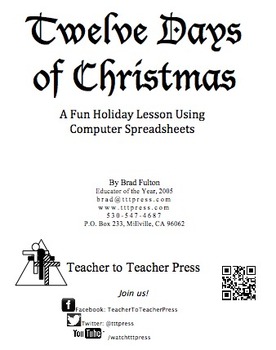
12 Days of Christmas: A Computer Spreadsheet Activity
This great holiday activity shows students how to use a computer spreadsheet to calculate the cost of their true love's gifts in today's dollars.The simple step-by-step procedure will allow both beginning and computer-savvy students to experience success as they learn how to use spreadsheet software. Students will enjoy the engaging and entertaining activity. No computer? No problem! Use the activity master so students can calculate the costs themselves.
Grades:
5th - 9th
Types:
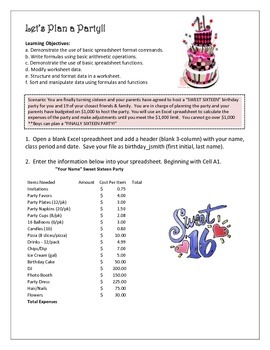
Excel 2010 - Let's Plan a Party/Budget
TSW create an excel spreadsheet to prepare a budget for a birthday party. The budget is $1,000 for a Sweet 16 or Finally 16 (for the boys) party. The students will determine amount of supplies needed for 20 guests and create formulas to calculate expenses and stay within the budget.
Grades:
7th - 12th
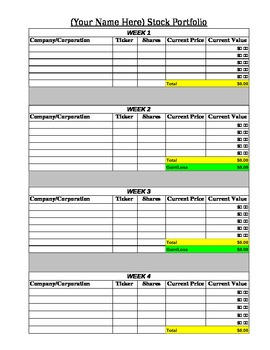
Stock Market Portfolio Tracking Spreadsheet
This document is an Excel spreadsheet which has already been formulated for students to use as part of a Stock Market unit. As students research and track their stocks, they will enter their data into the spreadsheet and their profit/loss will be automatically calculated along with a graph for students to analyze their results.
Subjects:
Grades:
4th - 8th
Types:
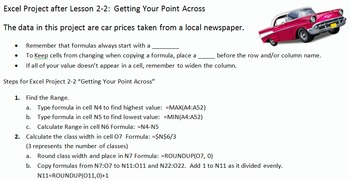
Excel Projects for Statistics Frequency Distributions and Charts
This file contains three different projects with solutions and a quick reference card for students. It correlates to Bluman's Elementary Statistics textbook.
First is an Introduction to Excel. There is an example, guided practice and then 4 Projects. The instructions are on each sheet. The topics covered are: basic editing and formatting, beginning charts, beginning formulas, such as SUM and AVERAGE, and calculations. There is an editable grading rubric for this project. The Preview file
Subjects:
Grades:
8th - 11th, Higher Education, Adult Education
Types:
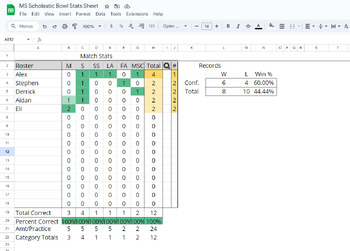
MS Scholastic Bowl / Quiz Bowl Stat Sheet
DISCLAIMER: Made for IESA-Compliant Scholastic Bowl. 24 questions per round, 10 point toss-ups, 4 part bonus (each bonus worth 5 points).This is a stat sheet for MIDDLE SCHOOL Scholastic Bowl/ Quiz Bowl practices and games. It adapts in real-time to update the scoreboard and team totals when a name and category abbreviation is applied (see thumbnails for example) The sheet tracks math, science, social studies/history, language arts, fine arts, and miscellaneous questions. It is incredibly useful
Subjects:
Grades:
6th - 8th
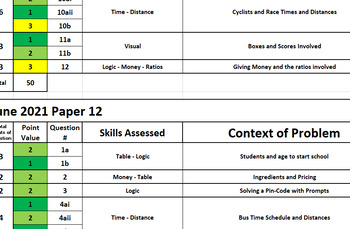
AICE Thinking Skills - Curriculum and Exam Breakdowns
(This product had originally been mistakenly uploaded incorrectly and then fixed but the negative review has never been taken down)This product includes a day-by-day breakdown of an entire First Semester, which covers all skills involved for AS level except the writing application needed in questions #2 and #5 on Paper 2. It includes all AS level Problem Solving Skills for Paper 1, as well as the AS level skills needed for questions #1, #3 and #4 (RAVEN, Main Conclusion, Intermediate Conclusion,
Grades:
8th - 12th, Higher Education
Types:
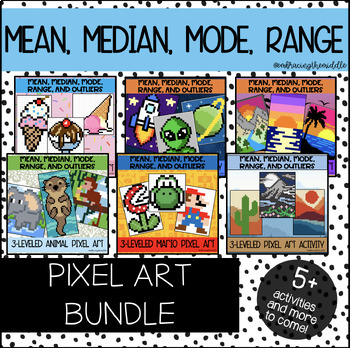
Mean, Median, Mode, and Range Pixel Art BUNDLE for Middle Schoolers | Math
This growing bundle will provide you with 6 pixel art activities that can help deepen student understanding of mean, median, mode, range, and outliers. These pixel art activities have three different levels of knowledge. Gives teachers more flexibility to support individual student needs. This resource can be used in the classroom as a formative assessment, independent classwork, homework, or much more! Students will solve 10 mean, median, mode, and range problems to reveal a mystery image. Give
Subjects:
Grades:
6th - 8th
Types:
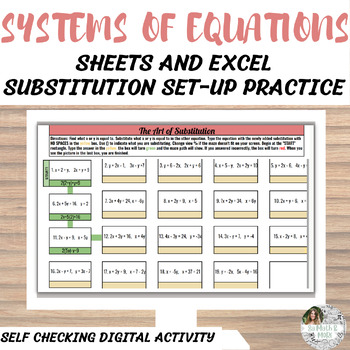
Solve Systems by Substitution | Set-Up Practice | Google Sheets and Excel MAZE
Do your students need help with substituting an integer, term or expression BEFORE actually solving a system? If so, this self-checking/self-guiding MAZE is for you!!A self-checking digital maze made on Google Sheets and Excel is a fun and interactive way for students to practice substituting an integer, term, and expression before actually solving a system of equations. This type of activity is especially helpful for students who struggle with algebraic concepts or who may make common mistakes
Subjects:
Grades:
7th - 10th
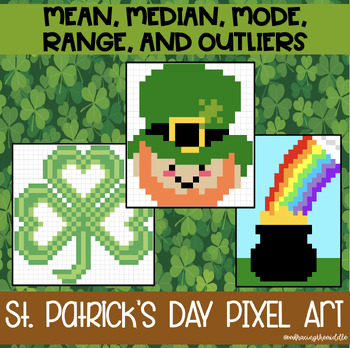
Mean, Median, Mode, Range 3-Leveled St. Patrick's Day Pixel Art | 7th Grade Math
This ST. PATRICK'S DAY pixel art activity has three different levels of mean, median, mode, range, and outlier problems. Gives teachers more flexibility to support individual student needs. This resource can be used in the classroom as a formative assessment, independent classwork, homework, or much more! Students will solve 10 equations to reveal a mystery image. Gives students automatic feedback and is no prep. Awesome activity to incorporate technology into the math classroom. Keep math fun a
Subjects:
Grades:
6th - 8th
Types:
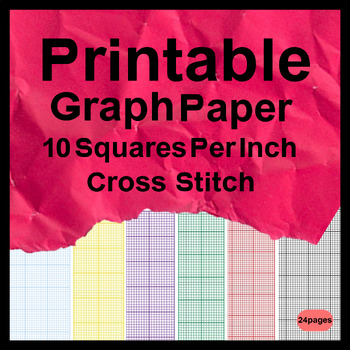
Printable Graph Paper 10 Squares Per Inch Cross Stitch
Printable Graph Paper 10 Squares Per Inch Cross Stitch - Grid paper is essentially the type of paper most commonly used for drawing and sketching purposes. It is widely used for making plan charts, designing websites, developing home ideas and so forth. A great deal of businesses who need to produce a company card, business brochures, catalogues, brochures, and so forth need this kind of graph paper.
Subjects:
Grades:
5th - 12th
Presidential Data Analyst Math Project | Excel | Presentations | Presidents Day
Elevate your Presidents' Day lesson plans with this comprehensive Presidential Data Analysis Math Project, designed to engage students in a deep exploration of U.S. presidential history through mathematical analysis. This invaluable resource provides educators with everything they need to guide their students through a dynamic and informative project that combines historical research with mathematical concepts.**Key Features:**1. **Thematic Relevance:** - Aligned with Presidents' Day, this o
Subjects:
Grades:
7th - 10th

Water Balloon Catcher Project - Data and Graphing - Mathematics
Transform your maths classroom into a dynamic hub of learning with this captivating data and graphing project! Designed for upper primary/middle school students, this hands-on and inquiry-based activity ensures an immersive experience in mastering data interpretation, chart creation, and understanding the role of data and graphs in advertising.In this engaging project, students will: Explore Data: Collaborate in teams to design and construct a Water Balloon Catcher using recycled materials, each
Subjects:
Grades:
5th - 9th
Types:
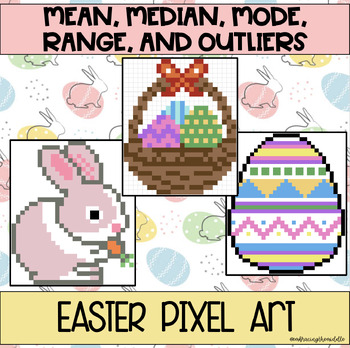
Mean, Median, Mode, Range 3-Leveled Easter Pixel Art for Middle School Math
This EASTER pixel art activity has three different levels of mean, median, mode, range, and outlier problems. Gives teachers more flexibility to support individual student needs. This resource can be used in the classroom as a formative assessment, independent classwork, homework, or much more! Students will solve 10 equations to reveal a mystery image. Gives students automatic feedback and is no prep. Awesome activity to incorporate technology into the math classroom. Keep math fun and engaging
Subjects:
Grades:
6th - 8th
Types:
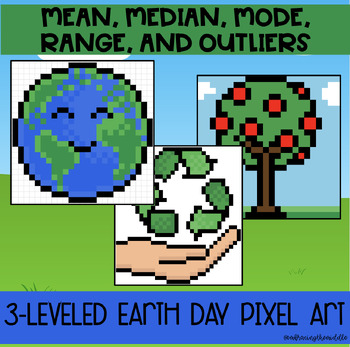
Mean, Median, Mode, Range 3-Leveled Earth Day Pixel Art for 7th Grade Math Class
This EARTH DAY pixel art activity has three different levels of mean, median, mode, range, and outlier problems. Gives teachers more flexibility to support individual student needs. This resource can be used in the classroom as a formative assessment, independent classwork, homework, or much more! Students will solve 10 equations to reveal a mystery image. Gives students automatic feedback and is no prep. Awesome activity to incorporate technology into the math classroom. Keep math fun and engag
Subjects:
Grades:
6th - 8th
Types:
Also included in: Earth Day Themed Pixel Art BUNDLE for Middle School Math
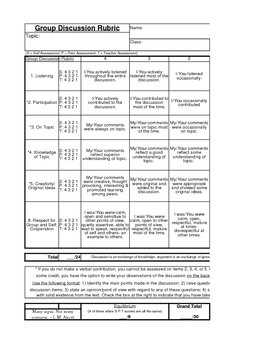
Group Discussion Rubric
Use this rubric whenever you have a class discussion. It provides a tangible way of grading these discussion, it teachers discussion behavior/skills, and it helps manage the discussion time. Students rate themselves and are rated by each other and the teacher completes a rating. Points are awarded for synchronicity of ratings. Repeated use of this rubric reinforces dicussion skills and solidifies the application of these skills. Students who do not choose to verbally contribute in the discussion
Grades:
6th - 12th, Higher Education
Types:
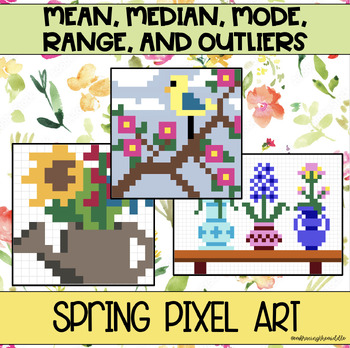
Mean, Median, Mode, Range 3-Leveled Spring Pixel Art for Middle School Math
This SPRING pixel art activity has three different levels of mean, median, mode, range, and outlier problems. Gives teachers more flexibility to support individual student needs. This resource can be used in the classroom as a formative assessment, independent classwork, homework, or much more! Students will solve 10 equations to reveal a mystery image. Gives students automatic feedback and is no prep. Awesome activity to incorporate technology into the math classroom. Keep math fun and engaging
Subjects:
Grades:
6th - 8th
Types:
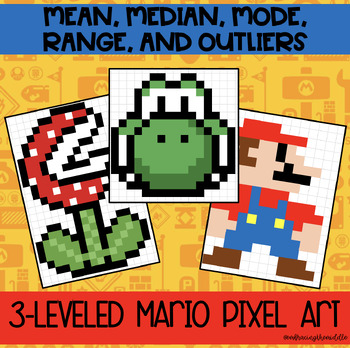
Mean, Median, Mode, Range 3-Leveled Mario Pixel Art for Middle Schoolers
This MARIO pixel art activity has three different levels of mean, median, mode, range, and outlier problems. Gives teachers more flexibility to support individual student needs. This resource can be used in the classroom as a formative assessment, independent classwork, homework, or much more! Students will solve 10 equations to reveal a mystery image. Gives students automatic feedback and is no prep. Awesome activity to incorporate technology into the math classroom. Keep math fun and engaging
Subjects:
Grades:
6th - 8th
Types:

Mean, Median, Mode, Range 3-Leveled Christmas Pixel Art for Middle Schoolers
This CHRISTMAS pixel art activity has three different levels of mean, median, mode, range, and outlier problems. Gives teachers more flexibility to support individual student needs. This resource can be used in the classroom as a formative assessment, independent classwork, homework, or much more! Students will solve 10 equations to reveal a mystery image. Gives students automatic feedback and is no prep. Awesome activity to incorporate technology into the math classroom. Keep math fun and engag
Subjects:
Grades:
6th - 8th
Types:
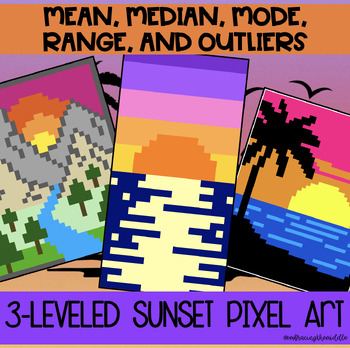
Mean, Median, Mode, Range 3-Leveled Sunsets Pixel Art for Middle School Math
This SUNSET pixel art activity has three different levels of mean, median, mode, range, and outlier problems. Gives teachers more flexibility to support individual student needs. This resource can be used in the classroom as a formative assessment, independent classwork, homework, or much more! Students will solve 10 equations to reveal a mystery image. Gives students automatic feedback and is no prep. Awesome activity to incorporate technology into the math classroom. Keep math fun and engaging
Subjects:
Grades:
6th - 8th
Types:

Mean, Median, Mode, Range 3-Leveled Valentine's Day Pixel Art | 7th Grade
This VALENTINE'S DAY pixel art activity has three different levels of mean, median, mode, range, and outlier problems. Gives teachers more flexibility to support individual student needs. This resource can be used in the classroom as a formative assessment, independent classwork, homework, or much more! Students will solve 10 equations to reveal a mystery image. Gives students automatic feedback and is no prep. Awesome activity to incorporate technology into the math classroom. Keep math fun and
Subjects:
Grades:
6th - 8th
Types:
Manage Sports Statistics in Google Drive / Google Sheets - Activity
Use Google Sheets to analyze sports data
This activity lets students practice several fundamental spreadsheet skills, including:
-renaming documents
-adding formulas
-inserting / formatting charts
Screenshots demonstrate how to do all of the above in Google Sheets, the spreadsheet application in the Google Drive suite. You can add additional statistics to customize the assignment for your students and adjust the level of difficulty.
Aligned to the following Massachusetts Technology Literacy
Grades:
5th - 8th
Types:
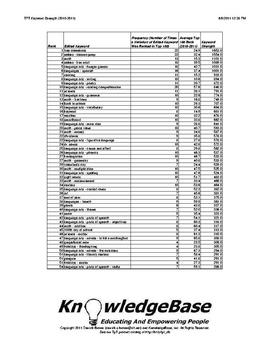
TPT KeyWord Strength Index (2010-2011) - Downloadable Spreadsheet!
What are the strongest keywords on TpT?
1. free downloads
2. Deanna Jump
3. math
Neither #1 nor #2 are surprises, but #3 (math) was certainly a surprise to me!
This report analyzes TpT's 2010-2011 keywords using a measure called "keyword strength".
The measure is based on a keyword's average rank, as well as the number of times it appeared in the 2010-2011 "Top 100" TpT search engine rankings.
This can be a valuable tool to help sellers understand TpT's marketplace supply and demand!
The P
Subjects:
Grades:
PreK - 12th, Higher Education, Adult Education, Staff
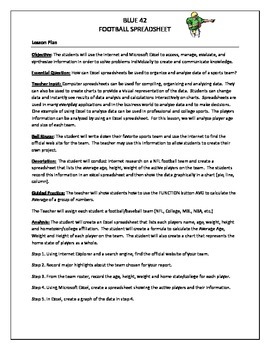
Project Football in Excel
Students will research a favorite sports team and create an Excel spreadsheet listing players name, age, hometown, weight and height. Students will use the FUNCTION button in Excel to calculate the average age, weight and height of players on their team. Students will also write a one page summary on their data analysis and team information and can also create a PowerPoint presentation that includes Excel charts to analyze the team data.
Grades:
7th - 11th
Types:
Showing 1-24 of 107 results

