75 results
7th grade graphing interactive whiteboards $5-10
Analyzing Data & Interpreting Graphs Digital Task Cards for BOOM Learning BUNDLE
Great for both digital and traditional learning, this bundle contains three decks of twenty-five cards and one deck of nine cards for a total of 84 cards about data analysis and graph interpretation. Line graphs, bar graphs, and pie charts are all included. The question types include typing the correct response, answering True or False, and clicking the correct response.The Boom Decks included in this bundle are listed below:Analyzing Data and Interpreting Graphs Volume 1Analyzing Data and Inter
Subjects:
Grades:
5th - 8th

Geometry PowerPoint Unit Bundle | Tools of Geometry DISTANCE LEARNING
Teachers, save yourself time creating lessons! This fully editable PowerPoint bundle of six lessons is professionally designed and teaches students the important foundations of Geometry. This bundle includes six lessons for a total of 59 animated slides encouraging continued student engagement.Essential Skills from this unit:sketch using appropriate markingsinterpret sketches and markingsunderstand accurate definitionsunderstand the relationships between basic angle pairsapply algebra to interpr
Grades:
7th - 10th
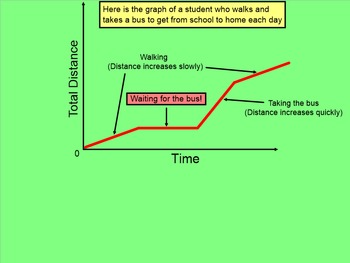
How I Teach Relating Graphs To Events
This is a 25 page Smartboard file describing how to graph situation on a coordinate graph according to different events. The lesson describes what situations make a line go up, go down, or stay horizontal. Sometimes the students have to graph the situation and sometimes the students have to write a story that matches a given graph. I also have a worksheet that goes with this.
Subjects:
Grades:
6th - 9th
Types:

Geometry PowerPoint Unit Bundle | 3D & Measurement DISTANCE LEARNING
Teachers, save yourself time creating lessons! This fully editable PowerPoint bundle of five lessons is professionally designed and teaches students the important skills related to 3D solids and their measurements. This bundle includes five lessons for a total of 42 animated slides encouraging continued student engagement.View the Preview and Videos from each product to see just what you receive in this resource.Desired Learner Outcomes from this unit:I can classify as solid as a polyhedron or n
Grades:
7th - 10th
CCSS:
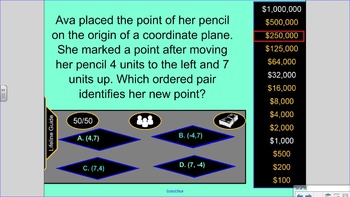
Who Wants to be a Millionaire 6th Grade Math Review VA SOL 6.3, 6.10, 6.12, 6.11
Who Wants to be a Millionaire 6th Grade Math Review VA SOL 6.3, 6.10, 6.12, 6.11. Contains 2 rounds.
SOL 6.3- Integers and Absolute Value
SOL 6.10- Area, Perimeter, and Circumference
SOL 6.12- Quadrilaterals
SOL 6.11- Coordinate Planes
Grades:
6th - 8th
Types:
Also included in: Math 6 Virginia SOL Review Games Bundle (old standards)
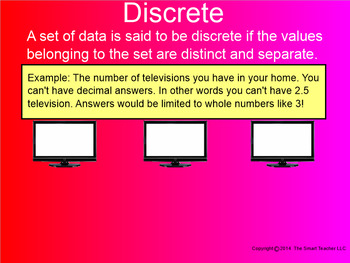
How I Teach Discrete or Continuous Graphs
This is a 33 page Smartboard file explaining the difference between Discrete and Continuous. Students learn that Discrete data is counted and that Continuous data is measured. Students practice by seeing short situations and by looking at the coordinate plane. There are many examples with answers.
Subjects:
Grades:
7th - 10th
Types:

Scatter Plots SMART Notebook, Foldable & Printables Middle School Math
This comprehensive package covers a lesson on scatter plots using a layered-book foldable. Lesson plans, instructions on how to make the foldable, an assignment, answer keys and the lesson on SMART Notebook are all included. All materials are downloadable and printable. Complete math lesson in a box! More than teaching how to identify and interpret the 3 trends found in scatter plots, this package teaches how to teach identifying and interpreting the 3 trends found in scatter plots.
PLEASE
Grades:
6th - 8th

Statistics Activity
This powerful activity focuses on using the TI 84+ calculator to calculate the mean, median, range, z-score, standard deviation, mean absolute deviation, permutations, combinations, and probabilities with normal distribution. You will also gain insight on how to create multiple box and whisker plots on one graph.
This is aligned to the Common Core and VA SOLs A.9, A.10, AII.11, and AII.12.
Subjects:
Grades:
7th - 12th
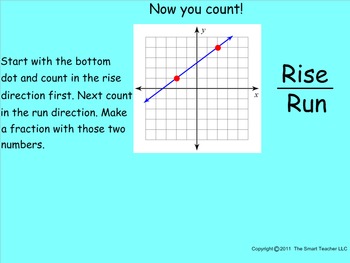
How I Teach Slope Part 2
This is a 40 page Smartboard lesson covering slope. This lesson picks up where part 1 leaves off. The student learns to use rise over run to build answers according to a graphed line. The first several answers already have 2 points plotted for the students. The lesson then progresses to where the students have to plot 2 points on their own. the points are off to the side and the teacher can have students come up to the board for some interaction. All pages include answers.
Grades:
7th - 10th
Types:
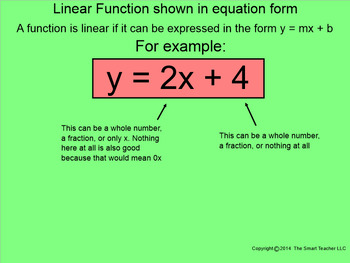
How I Teach Linear and Nonlinear Functions
This is a 33 page Smartboard lesson explaining how to identify functions as linear and nonlinear. Students see 3 different types of functions. Functions as equations, functions graphically, and functions in a table. All have various types and styles and all examples have answers.
Subjects:
Grades:
7th - 10th
Types:
Solving Systems of Equations by Substitution SMARTBoard Lesson/Notes/HW (A4.3a)
This is a direct instruction lesson that I previously taught utilizing my SMARTBoard. I split the Solving Systems by Substitution into 3 separate lessons. Lesson 1 (A4.3a) is obvious substitution problems (slope-intercept/slope-intercept or slope-intercept/standard form). Lesson 2 (A4.3b) has all standard form-like problems with one equation being obviously easier to convert to slope-intercept than another. Lesson 3 (A4.3c) has all standard form-like problems with no equation necessarily being e
Grades:
7th - 10th
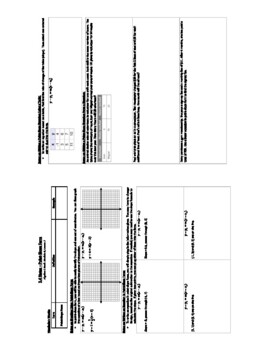
Point-Slope Form SMARTBoard Lesson, Notes, HW (A3.4)
This is a direct instruction lesson that I previously taught utilizing my SMARTBoard. Included in the Product Preview are the blank notes that you can provide for your students that accompany the SMARTBoard lesson. Also included in the Product Preview are the completed filled-in notes from when I taught the lesson, so you can see a sample of the problems in the SMARTBoard. You will also see the worksheet that students can be assigned after the lesson that aligns to what was taught. By purchasin
Grades:
7th - 10th
How I Teach Slope Part 4
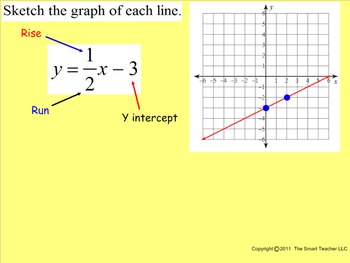
This is a 48 page Smartboard lesson on how to graph linear equations. All types of linear equations are explained here. There are slopes that are fractions and slopes that are whole numbers. Sometimes the y intercept is missing and other times there is zero slope. There are plenty examples to work with and all contain the answer. Students have a graph and a dot so that they are able to plot a couple of points and then connect them to graph the linear equation.
Grades:
7th - 10th, Higher Education
Types:

How I Teach Writing Inequalities
This is a 31 page Smartboard file teaching students how to write inequalities. The lesson begins with a review of the inequality symbols and what they mean. The lesson progresses into how to look at a graph and write an inequality that matches it. There are plenty of practice pages that include answers.
Grades:
7th - 10th
Types:
How I Teach the Coordinate Plane
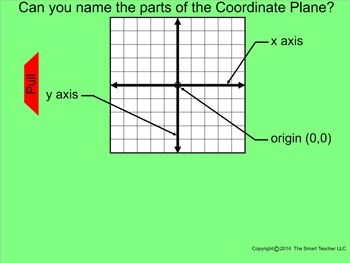
This is a 36 page Smartboard file over the Coordinate Plane. This lesson starts by explaining the parts of the coordinate plane. This would include the two axis lines and the origin. The lesson names the quadrants and shows the sign of ordered pairs in each quadrant. There is lots of practice plotting points and naming quadrants. All practice pages include answers.
Subjects:
Grades:
5th - 8th
Types:

How I Teach Scatter Plots (Line of Best Fit)
This is a 30 page Smartboard file over scatter plots. The lesson describes positive, negative, and no correlation. Students have plenty of practice looking at graphs of ordered pairs and trying to determine the line of best fit. Each practice page includes answers.
Grades:
7th - 10th
Types:
Coordinate Grid Worksheets and Smartboard Slides Lesson BUNDLE
Teachers ~ You'll LOVE these TERRIFIC Coordinate-Grid-Plane-Worksheets and Smartboard-Slides-BUNDLE that is literally EVERYTHING you need to teach this skill/concept! You'll enjoy using these resources year after year!Be sure to L@@K at my other 1,285+ TERRIFIC teaching resources!~ ~ THANK YOU KINDLY ~ ~
Subjects:
Grades:
4th - 7th
Coordinate Graphing on 4 Quadrants Foldable & SMART Notebook Lesson MS Math
This comprehensive package covers a lesson on graphing coordinates on all four quadrants using a shutter foldable. Lesson plans, printable foldable, an assignment,answer keys, and the lesson presented in SMART Notebook are all included. All materials are downloadable and printable. Complete math lesson in a box! More than teaching how to graph coordinates, this package teaches how to teach graphing coordinates.
PLEASE READ BEFORE PURCHASING THIS PRODUCT
If you are interested in the purchasi
Grades:
6th - 8th
How I Teach Set Theory (Unions, Intersections, and Complements)
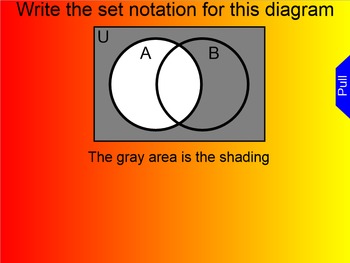
This is a 55 page Smartboard file over Set Theory. The 3 topics I'm focusing on are Union, Intersections, and Complements while reading a Venn Diagram. The lesson gives easy to understand definitions along with visuals. There are 2 and 3 circle diagrams. Sometimes students look at the diagram and read it and other times students look at and answer and write the set theory that matches what the graph is showing. There are plenty examples with answers.
Grades:
7th - 10th
Types:
How I Teach Slope Part 1
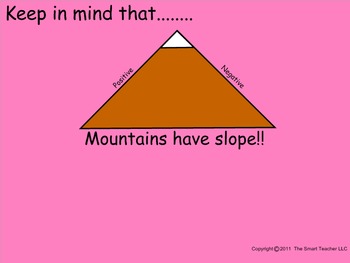
This is a 28 page Smartboard file explaining the beginning basics of finding the slope of a line. The students learn about positive slope, negative slope, zero slope, and an undefined line. One the four have been explained there is several pages of practice looking at a graph and deciding between positive, negative, zero, and undefined.
Grades:
7th - 10th
Types:
How I Teach Slope Part 3
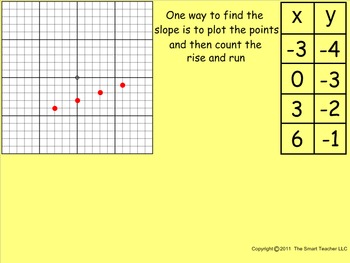
This is a 28 page Smartboard file on how to find the slope of an x and y table. The lesson explains how you can plot the points to find the slope or you can use the change in y over change in x (rise over run) formula. Each practice page has a coordinate plate to help. There are plenty of practice pages and all include answers.
Grades:
7th - 10th, Higher Education
Types:

Distance-Time Graphs Digital Math Lesson for 7th to 8th Grades CCSS.7.EE.B.3
Distance-Time Graphs Digital Math Lesson for 7th to 8th Grades CCSS.7.EE.B.3In this lesson, learners will be able to construct linear functions arising from real-life problems and plot their corresponding graphs.Discuss and interpret graphs arising from real situations.Discuss and interpret distance-time graphs.Buy this great value bundle of interactive lessons today to save you hours of planning and don't forget to leave an honest review if you download this 7th grade math activities for TPT cr
Subjects:
Grades:
7th - 8th
How I Teach Graphing Using X and Y Intercepts
This is a 31 page Smartboard file over how to graph linear equations using x and y intercepts. The lesson explains what it means to be in standard form. Next the lesson has the students fill out an x-y table and plot the points. The last examples are when the intercepts are not whole numbers. There are plenty of practice pages with answers included.
Subjects:
Grades:
7th - 10th
Types:
How I Teach Box and Whisker Plots
This is a 36 page Smartboard file covering Box and Whisker plots. Students learn about upper and lower quartiles, minimum and maximum, and finding medians. The lesson leads the students through the process one step at a time. There are plenty of practice pages that all include answers.
Grades:
6th - 9th, Staff
Types:
Showing 1-24 of 75 results


