399 results
6th grade Common Core 7.SP.B.4 resources under $5
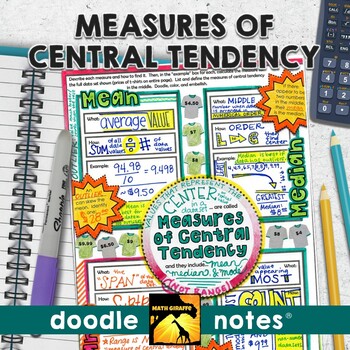
Measures of Central Tendency Doodle Notes (Mean, Median, Mode, & Range)
Mean, Median, Mode, and Range (Measures of Central Tendency): "doodle notes" - visual note taking pages with interactive tasks for building stronger retention of measures of center (mean, median, mode, and range) for your middle school statistics unit in Pre-AlgebraBoost your students' focus and memory! The blend of graphic and linguistic input in these guided visual notes helps students' brains to convert the information to long-term memory more easily.When students color or doodle in math clas
Subjects:
Grades:
6th - 8th
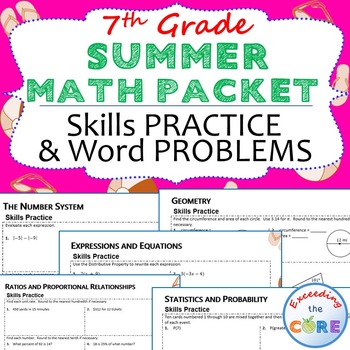
7th Grade SUMMER / June - July MATH PACKET - {Review/Assessments of Standards}
This 7th Grade SUMMER Math Packet has it all and requires NO PREP! The resources in this packet are designed to meet the state standards for 7th grade math.What is Included:I have included questions from each of the 7th grade domains, and each domain(topic) is on a different page so that you may customize this packet as needed. These questions are aligned to the 7th grade learning standards, making this the perfect resource for fluency and problem solving.Topics Include* page 2 - The Number Syst
Subjects:
Grades:
6th - 8th
Types:
Also included in: 7th GRADE MATH Assessments, Warm-Ups, Task Cards, Worksheets BUNDLE
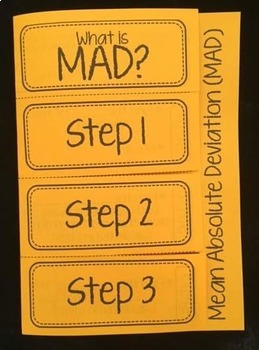
Mean Absolute Deviation MAD Foldable Notes
This editable foldable provides an introduction to Mean Absolute Deviation (MAD). Students will take notes on the meaning of MAD, the steps for finding MAD, and complete 1 example.This works great whole group/ guided instruction, in math centers, as a class work/ homework assignment, or even as an exit slip. Perfect for interactive math notebooks!Now with two options and an editable PowerPoint version!This product is also included in the following bundles:★ 6th Grade Math Foldable + Activity B
Subjects:
Grades:
6th - 7th
Types:
CCSS:
Also included in: Data Analysis and Statistics Foldable Bundle
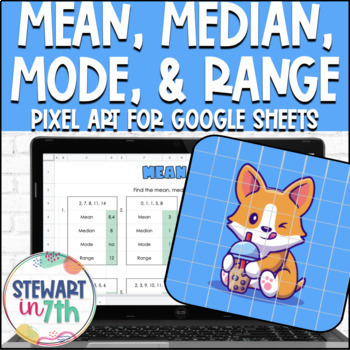
Mean, Median, Mode, Range Digital Pixel Art Activity
In this digital activity, students find the mean, median, mode, and range of 12 different sets of data. NO PREP is required - activity is ready to share with students as-is! This activity is self checking; students are able to receive immediate feedback. Incorrect answers turn the answer box red, while correct answers fill in the image. Teachers can easily see how far students have progressed, as well as problem areas. This is a great activity for virtual or in person learning!A printable recor
Subjects:
Grades:
6th - 7th
Types:
Also included in: 7th Grade Statistics Digital Activity Bundle
Grade 7 Ontario Report Card Comments Math British Columbia Common Core EDITABLE
SAVE TIME and write your best Grade 7 math report card comments in Ontario, BC, and Common Core. Includes report card comments for progress reports, Term 1 report cards, and end of year report cards. Copy and paste directly into your report card program or edit to personalize for your students.We have also included separate report card comment banks that align with British Columbia math curriculum and the Common Core math curriculum Whether you're a new teacher, new to grade 7, or just looking f
Subjects:
Grades:
6th - 8th
Types:
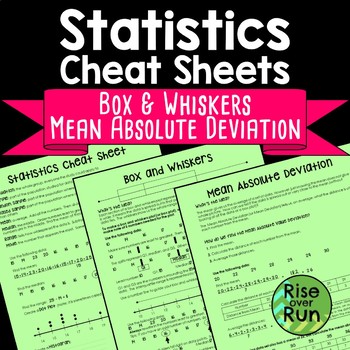
Box and Whiskers and Mean Absolute Deviation Cheat Sheets
Help students understand statistics vocabulary, dot plots, histograms, and box and whiskers diagrams, and mean absolute deviation with this resource.The three-page handout comes in two formats:Reference “Cheat Sheet” with all information filled in (pages 2-4)Guided Notes format with fill-in blanks and practice problems (pages 5-7)The first sheet defines important terms and helps students understand dot plots (or line plots) and histograms. The second sheet guides students in creating a box and w
Subjects:
Grades:
6th - 9th
Types:
CCSS:
Also included in: 7th Grade Math Activities, Lessons, Projects & More Bundle
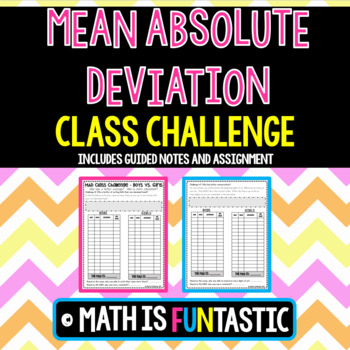
Mean Absolute Deviation - Class Challenge
Are you looking for an engaging way to teach Mean Absolute Deviation? Look no further! My students love completing this lesson.
This product is designed to help your students master the MAD in three easy steps.
1) Guided Notes – The guided notes contain an introduction to calculating MAD. Students will write the overall meaning of the MAD and the steps to calculating. There is an example problem for the teacher to model and then two “you try” problems for students to try independently a
Subjects:
Grades:
6th - 9th
Types:
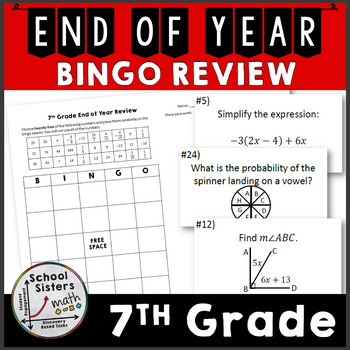
7th Grade Math End of Year Review - BINGO and Task Cards
Are you looking for an engaging activity to help your 7th graders get ready for end of year state testing? This 7th grade math bingo game is a great way to review for end of year state testing or just have a fun review day at the end of the year!! This resource will make your life easier because it is an easy, no prep printable resource, including 30 task cards and a BINGO game board. Students will create their own BINGO game sheet so you won't need to spend hours preparing that. This bingo game
Subjects:
Grades:
6th - 8th
Types:
Also included in: 7th Grade Math End of Year Level Review Activity Bundle
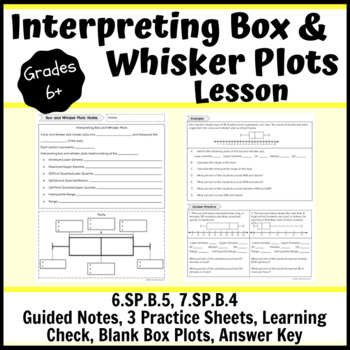
Interpreting Box and Whisker Plots Lesson- Notes, Practice, Learning Check
This interpreting box and whisker plots lesson consists of a guided notes sheet, 3 practice sheets, a learning check, 2 different half sheets of blank box plots and an answer key. You can hole punch the note pages and have students place them in their binders or a 3-prong folder. There are teacher notes to guide you through the direct instruction with students. There are three pages of practice. One page can be used as independent practice when students are ready; this could be in class or homew
Subjects:
Grades:
6th - 10th
Types:
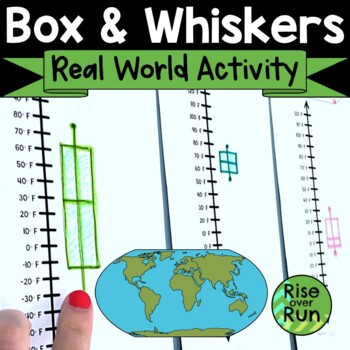
Box and Whiskers Plot Activity with Real World Data Comparisons
Help students understand how and why to use box & whiskers plots with this real world application using data about temperatures in different cities. Students use data about the highest average temperature for each month in a city. They locate it on a world map and then create a vertical box plot using the vertical number line provided. Once students create their individual cities’ box plots, all the data can be displayed on a wall for comparison. This leads to some great discussions about t
Subjects:
Grades:
6th - 7th
Types:
Also included in: Algebra 1 and 8th Grade Math Curriculum Bundle for Entire Year
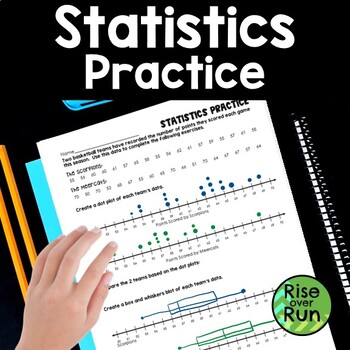
Box and Whiskers and Dot Plot Practice
Practice creating dot plots and box & whiskers plots with this statistics activity.Students are given scores for 2 basketball teams. They use the data to create a dot plot (or line plot) for each team and then a box and whiskers diagram for each team.Then, they compare the data of the teams.A bonus question asks students to calculate the mean absolute deviation.This worksheet can lead to great discussions about how to analyze box and whisker diagrams and make comparisons!
Subjects:
Grades:
6th - 7th
Types:
CCSS:
Also included in: Algebra 1 and 8th Grade Math Curriculum Bundle for Entire Year
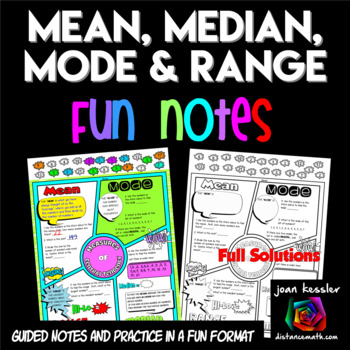
Measures of Central Tendency FUN Notes Doodle Pages
Your students will love learning the Measures of Central Tendency with these Fun Notes done in a comic book theme. Topics include Mean, Median, Mode, and Range. Students complete 6 problems plus definitions. There are two versions of the notes so you can differentiate. The PDF also includes 2 sizes, one standard 81/2 x 11" and the other in half size for INB's. Students love to doodle while learning and it has been shown that doodling and working with fun themed activities help students engage
Subjects:
Grades:
6th - 9th
Also included in: Algebra 1 FUN Notes Doodle Page Bundle
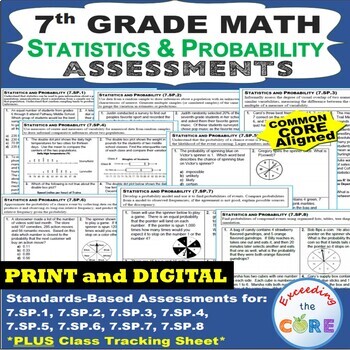
7th Grade STATISTICS & PROBABILITY Assessments (7SP) Common Core PRINT & DIGITAL
Assess your students' understanding of the 7th Grade STATISTICS & PROBABILITY (7.SP) Common Core.What is included:► a 1-page quick assessment for EVERY standard in the STATISTICS & PROBABILITY domain for 7th grade► a CLASS TRACKING SHEET to look at all of your students progress at a glancePrint and Digital (updated September 2020)✔️ PRINT VERSION - a PDF file that you may PRINT✔️ DIGITAL VERSION - made with Google Slides. Students type their answers directly on the slides in the provide
Subjects:
Grades:
6th - 8th
Types:
Common Core Assessments Math - 7th - Seventh Grade - Statistics Probability 7.SP
Your Choice!!! Formal Assessment, Worksheets, or Task Cards
Questions are aligned precisely to the common core math standard. Each page contains at least 4 questions for each of the 8 common core math standards in THREE different formats.
This assessment is a SUBSET of my
Common Core Assessments / Warm Ups - Entire 7th Grade
Common Core Math 7th Assessments - Warm Ups - Task Cards - Seventh Grade
7.SP Statistics and Probability
Your Choice!!! Formal Assessment, Worksheets, or Task Ca
Subjects:
Grades:
6th - 8th
Types:
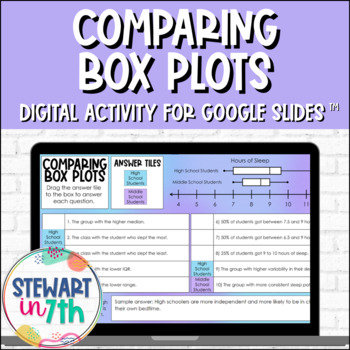
Comparing Box Plots Digital Activity
Students will use box and whisker plots to compare two populations in this fully digital resource. Two sets with 11 questions each are included: 10 drag and drop, 1 free response - 22 questions total. Intended for Google Classroom and Google Slides, this is great for distance learning or virtual teaching. Microsoft Teams users can download this resource from their Google account as a PowerPoint.******************************************************************************************************
Subjects:
Grades:
6th - 8th
Types:
Also included in: 7th Grade Statistics Digital Activity Bundle
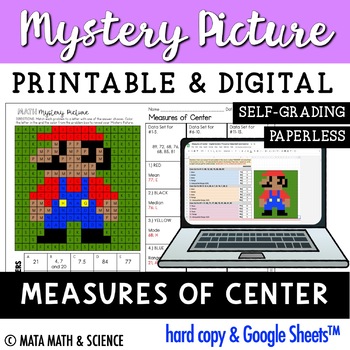
Measures of Center: Math Mystery Picture
About this resource:In this challenge, students solve 15 measures of center problems, finding the mean, median, mode, range and interquartile range (IQR) of three different data sets. Each correct answer will reveal a bit of the mystery picture. Students will be motivated to complete the math problems until all pixels are revealed!What's included?Printable Mystery PictureGoogle Sheets™ versionInteractive Notebook Cover SheetShow work templates (small and large boxes)Answer keyStandards alignment
Subjects:
Grades:
6th - 9th
Also included in: Every Single Math Mystery Picture: Growing MEGA BUNDLE for Middle School
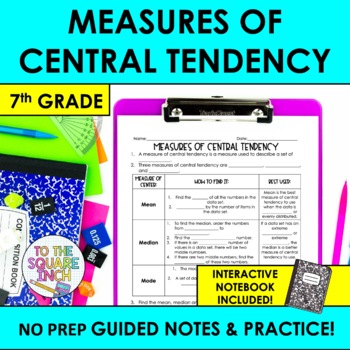
Measures of Central Tendency Notes & Practice | + Interactive Notebook Format
Searching for an effective way to teach your students measures of central tendency? These NO PREP guided notes are a classroom proven resource that will save you time and have your students proficient in measures of central tendency in no time! With a comprehensive design, these notes offer a structured approach that can be differentiated for every level of learner. Guided notes are an effective teaching model that maximize your students ability to use working memory to focus on content, rather
Subjects:
Grades:
6th - 8th
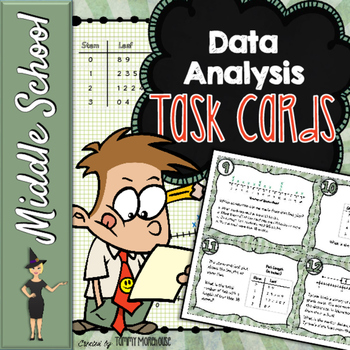
Data Analysis Task Cards
Data Analysis Task Cards
This is a set of 24 task cards covering multiple representations of data analysis including stem-and-leaf plots, box-and-whisker plots, line plots, and measures of central tendency. The questions are differentiated for a wide range of learners. These cards would be great for bell ringers, math stations, test prep, review, or just for fun!
What you get:
➸ 24 color task cards
➸ 24 black and white task cards
➸ Student answer sheet
➸ Key
You can laminate these and use th
Subjects:
Grades:
5th - 9th
Types:
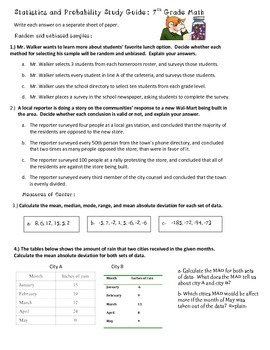
7th Grade Math Statistics and Probability Study Guide or Review
4 page study guide containing over 60 questions aligned to 7th grade SP common core standards. All questions are open-ended. Answer key is provided.
Covers the following topics:
~ Random and unbiased samples
~ Using data from a sample to make predictions about a population
~ Measures of central tendency
~ Range and mean absolute deviation
~ Box-and-whisker plots
~ The likeliness of an even occurring
~ Simple and compound probability
~ Independent and dependent events
~ Probability trees
This
Subjects:
Grades:
6th - 7th
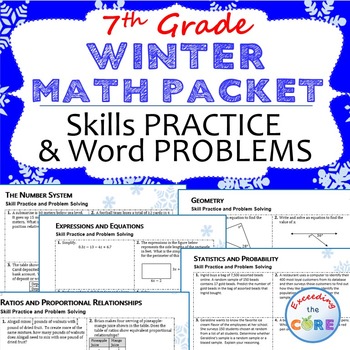
7th Grade WINTER / December MATH PACKET {Review/Assessments of Standards}
This 7th Grade Math WINTER Packet has it all and requires NO PREP! The resources in this packet are designed to meet state standards for 7th grade math.What is Included:I have included questions from each of the 7th grade domains, and each domain(topic) is on a different page so that you may customize this packet as needed. These questions are aligned to the 7th grade learning standards, making this the perfect resource for fluency and problem solving.Topics Include:* page 2 - The Number System
Subjects:
Grades:
6th - 8th
Types:
Also included in: 7th GRADE MATH Assessments, Warm-Ups, Task Cards, Worksheets BUNDLE
Quartiles, Interquartile Range (IQR), & Outliers
Straightforward sixth grade materials on quartiles, interquartile range (IQR), and the outlier calculation are very hard to find. I wrote these student pages to introduce these concepts in my statistics unit. The only prerequisite is how to find the median of a set of data.
Subjects:
Grades:
6th - 7th
Types:
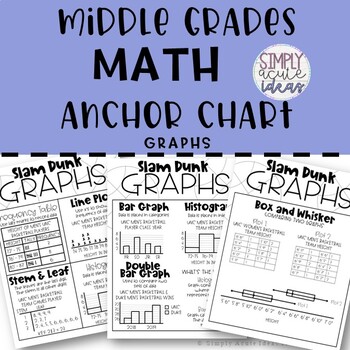
Types of Graphs Middle Grades Math Anchor Chart
Types of Graphs Middle Grades Math Anchor Chart - Anchor ChartWhat is included:This resource includes four types of graphs anchor charts for a teacher to project, trace, and enjoy. It also includes a student guided note page.How to use:Project, Trace, and Enjoy!Similar Resources:Related Products⭐ Adding and Subtracting Integers Middle Grades Math Anchor Chart⭐ Angle Relationship Math Anchor Charts⭐ Area Formula Middle Grades Math Anchor Chart⭐ Exponents Middle Grades Math Anchor Chart⭐ Integer N
Subjects:
Grades:
6th - 7th
Also included in: Middle Grades Math Anchor Charts GROWING BUNDLE
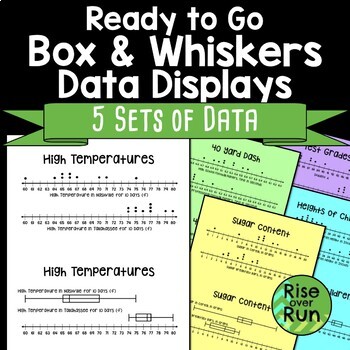
Box and Whiskers Plots Real World Examples
Practice comparing data shown in dot plots and box and whiskers diagrams with these 5 display sheets. Here's what's included:5 Data Display Sheets (Each sheet gives 2 sets of comparable data. The data is shown in dots plots and in box and whiskers plots.)Discussion Question IdeasI have had trouble finding large, neatly displayed data to use for statistics discussions and practice. That is why I created these sheets!Ideas for use:Stations: Use each sheet as a center. Each group of students stud
Subjects:
Grades:
6th - 7th
Types:
Also included in: Algebra 1 and 8th Grade Math Curriculum Bundle for Entire Year
Probability and Statistics Jeopardy Review 7th Grade Math
Jeopardy review game for the data and statistics unit for 7th grade math. 25 Review questions that scaffold from basic to complex. Questions align to my study guide and unit exam for the unit. Covers the following topics: Random Samples Making InferencesMeasures of Center and VarianceProbability ModelsCompound ProbabilityBox-and-Whisker Plots Answers included
Showing 1-24 of 399 results


