64 results
Free 6th grade Common Core 7.SP.B.4 resources
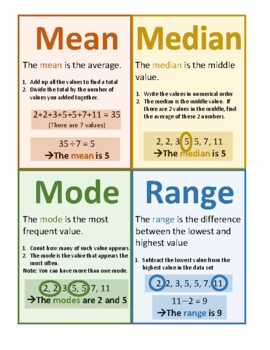
Mean Median Mode Range Poster Notes Anchor Chart
The PDF poster describes mean, median, mode, and range in an easy-to-understand and visual way. Enjoy!Check out my other posters here:STEM: Women in STEM Insp. Quotes, Women in STEM, Careers, Heroes Timeline, Inspirational Quotes from STEM HeroesABCs of Math: STEM Innovations, Amazing STEM facts, Careers, Shapes, in Nature Modern Style, in Nature Vintage Style, in Everyday LifeMath Vocabulary Alphabet: Elementary, Middle School, High SchoolMath in Art: Set A, Set B, Big BundleMath Modelling: Se
Subjects:
Grades:
5th - 9th
Types:
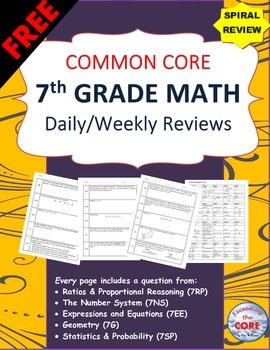
7th Grade Math Common Core Daily / Weekly SPIRAL REVIEW {2 Weeks FREE}
This FREE resource contains 2 WEEKS (10 problems) of review specifically written for the common core math standards for 7th grade. The review sheets are organized into 5 boxes. Each box contains problems from the 5 domains of the 7th grade CCSS standards.
This resource can be used for WARM UPS, HOMEWORK and math CENTERS. This is also a great resource for test prep.
*Get the FULL DOWNLOAD here! {20 WEEKS}
Being a 7th grade teacher myself, I created this resource to give my students daily and
Subjects:
Grades:
6th - 8th
Types:
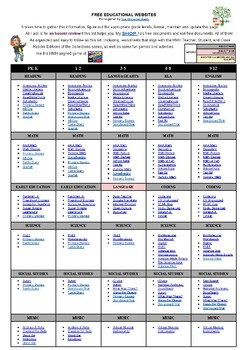
FREE EDUCATIONAL WEBSITES LIST 4 ALL GRADES K-12 AND SUBJECTS + TEACHER RESOURCE
Sometimes, you just need a list of websites for everyone. Here it is. FREE EDUCATIONAL WEBSITES Put together by Teach Me, Maria!It takes time to gather this information, figure out the appropriate grade levels, and format, maintain, and update this page. All I ask is for an honest review if this list helps you.
Subjects:
Grades:
PreK - 12th, Staff
Types:
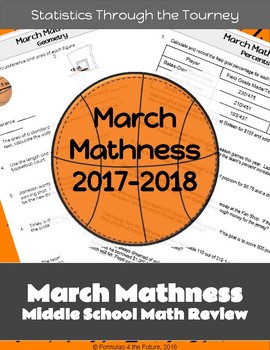
March Madness Math Middle School - Statistics
Middle School March Mathness - It's Tourney Time and almost Testing Time! What better way for students to review 7th Grade Statistics than through real-world questions involving players and teams in the 2018 NCAA Tournament. The questions engage students and help expand their knowledge of statistics in real-world context!
Get the entire BUNDLE at a DISCOUNT - Geometry, Statistics, Probability, and Percents for $3.25 using the link below:
https://www.teacherspayteachers.com/Product/Middle-S
Subjects:
Grades:
6th - 8th
Types:
Interquartile Range (IQR) & Box-and-Whisker Plot Review
This is a half sheet document with four questions to review both interquartile range and box-and-whisker plots. Can be used in an interactive notebook or as an exit ticket.No teacher prep for one page in an interactive notebook! Or you may use it as a quick exit ticket at the end of a class period. Very flexible with how you want to use the four questions. Save paper with the one sheet to two students ratio!Answer key is included for all four problems.I want to improve my products. If you have a
Subjects:
Grades:
6th - 9th
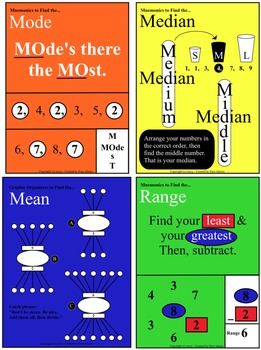
Mean, Median, Mode, & Range: Visuals w/ Memory Tools & Worksheets
Distinguishing the difference between mean, median, mode, and range has never been easier! Use these visuals and mnemonics in your classroom to help your students master the fantastic four! Included in this 44 page resource:Visuals for color & B/W printingMini visuals for student reference bindersPractice worksheets for each skillMixed practice worksheets on all skillsAnswer keysMean, Median, Mode, & Range Visuals with Memory Tools, Worksheets, & Answer Keys by Faye Adams is licensed
Subjects:
Grades:
6th - 7th
Types:
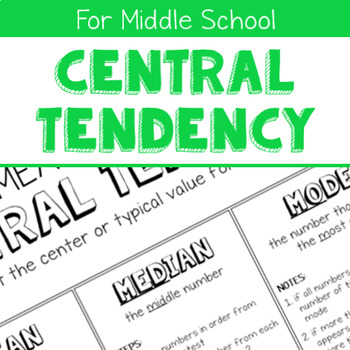
Measures of Central Tendency Notes Handout
This page of notes describes the three main measures of central tendency (mean, median, and mode), providing a definition as well as the steps for finding each measure.
Subjects:
Grades:
5th - 8th
Types:

Box and Whisker Plot
Students will be able to understand how to create and draw box and whisker plot diagrams through an activity that is student-centered and visual with some teacher-direction.This activity can be adapted for other data* rather than just heights of the students. *You can use height, how far a student can jump all starting at the same line, or even how far to throw a cotton ball -the examples are endless.This activity goes great with the comparison activity (this also has a color-coded answer key) -
Subjects:
Grades:
6th - 8th
Types:
CCSS:
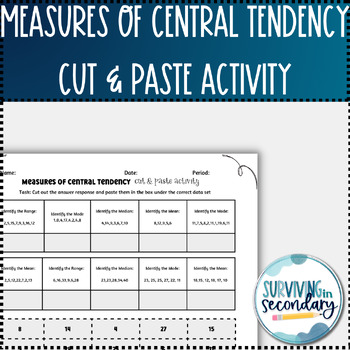
FREEBIE! Measures of Central Tendency Cut & Paste Activity
Measures of Central Tendency Cut&PasteLooking for a way to enhance your unit on the Measures of Central Tendency and practice mean, median, mode and range? Is your class feeling dry because there just isn’t enough diversity in your practice worksheets? Engage your classroom with this low-prep interactive activity. For this resource, students, either individually, or with partners, need to cut the answers at the bottom of the page and match them up with the correct problems. This lends itsel
Subjects:
Grades:
6th - 10th
Types:
CCSS:
Also included in: Measures of Central Tendency- Mean, Median, Mode and Range Bundle
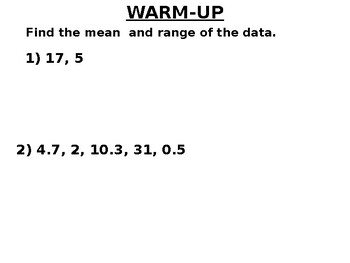
Math 7 18.5 Mean Absolute Deviation
This editable lesson was written by Alex Benn using the concepts described in his book Tenacious-Teaching: Uniting Our Superpowers to Save Our Classrooms and on his website: Tenacious-Teaching.com.Unit 18 Statistics18.1 Sampling18.2 Use Sampling to Draw Inferences (in-class worksheet)18.3 Find the Mean and Range (in-class worksheet)18.4 Understanding Mean and Range (in-class worksheet)18.5 Mean Absolute Deviation18.6 Median, Lower and Upper Quartiles (in-class worksheet)18.7 Use Median, Lower a
Subjects:
Grades:
6th - 7th
Also included in: Math 7 Unit 18 Statistics
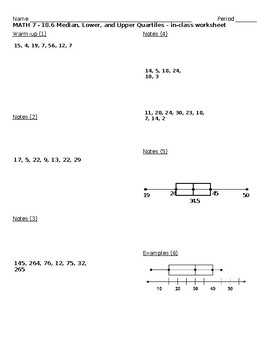
Math 7 18.6 Median, Lower, and Upper Quartiles classwork
This IN-CLASS WORKSHEET accompanies Math 7 Lesson 18.6 Median, Lower, and Upper QuartilesUnit 18 Statistics18.1 Sampling18.2 Use Sampling to Draw Inferences (in-class worksheet)18.3 Find the Mean and Range (in-class worksheet)18.4 Understanding Mean and Range (in-class worksheet)18.5 Mean Absolute Deviation18.6 Median, Lower and Upper Quartiles (in-class worksheet)18.7 Use Median, Lower and Upper Quartiles to Draw Inferences (worksheet)Review Unit 18Test Unit 18
Subjects:
Grades:
6th - 7th
Types:
Also included in: Math 7 Unit 18 Statistics
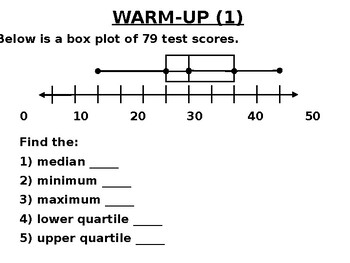
Math 7 18.7 Use the Median and Quartiles to Draw Inferences
This editable lesson was written by Alex Benn using the concepts described in his book Tenacious-Teaching: Uniting Our Superpowers to Save Our Classrooms and on his website: Tenacious-Teaching.com.NOTE: THERE IS A FREE 18.7 CLASSROOM WORKSHEET THAT ACCOMPANIES THIS LESSON AND ALLOWS STUDENTS TO FOLLOW ALONG.Unit 18 Statistics18.1 Sampling18.2 Use Sampling to Draw Inferences (in-class worksheet)18.3 Find the Mean and Range (in-class worksheet)18.4 Understanding Mean and Range (in-class worksheet
Subjects:
Grades:
6th - 7th
Also included in: Math 7 Unit 18 Statistics
Central Tendency Notes - Mean, Median, Mode, Range, and Outlier
These notes on central tendency (mean, median, mode, range, and outlier) are a great way to introduce the analysis of number sets! I have included examples for you to teach, or you can simply print out these notes for your students to have.
Subjects:
Grades:
6th - 9th
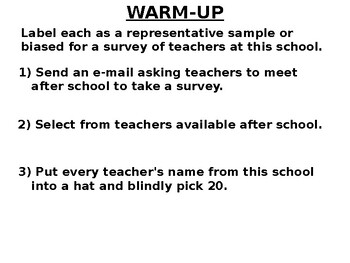
Math 7 Review Unit 18 Statistics
This editable lesson was written by Alex Benn using the concepts described in his book Tenacious-Teaching: Uniting Our Superpowers to Save Our Classrooms and on his website: Tenacious-Teaching.com.Unit 18 Statistics18.1 Sampling18.2 Use Sampling to Draw Inferences (in-class worksheet)18.3 Find the Mean and Range (in-class worksheet)18.4 Understanding Mean and Range (in-class worksheet)18.5 Mean Absolute Deviation18.6 Median, Lower and Upper Quartiles (in-class worksheet)18.7 Use Median, Lower a
Subjects:
Grades:
6th - 7th
Also included in: Math 7 Unit 18 Statistics
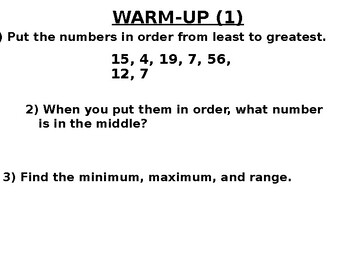
Math 7 18.6 Median, Lower and Upper Quartiles
This editable lesson was written by Alex Benn using the concepts described in his book Tenacious-Teaching: Uniting Our Superpowers to Save Our Classrooms and on his website: Tenacious-Teaching.com.NOTE: THERE IS A FREE 18.6 CLASSROOM WORKSHEET THAT ACCOMPANIES THIS LESSON AND ALLOWS STUDENTS TO FOLLOW ALONG.Unit 18 Statistics18.1 Sampling18.2 Use Sampling to Draw Inferences (in-class worksheet)18.3 Find the Mean and Range (in-class worksheet)18.4 Understanding Mean and Range (in-class worksheet
Subjects:
Grades:
6th - 7th
Also included in: Math 7 Unit 18 Statistics
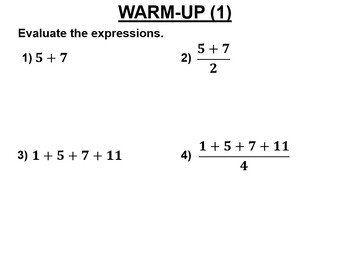
Math 7 18.3 Find the Mean and Range
This editable lesson was written by Alex Benn using the concepts described in his book Tenacious-Teaching: Uniting Our Superpowers to Save Our Classrooms and on his website: Tenacious-Teaching.com.NOTE: THERE IS A FREE 18.3 CLASSROOM WORKSHEET THAT ACCOMPANIES THIS LESSON AND ALLOWS STUDENTS TO FOLLOW ALONG.Unit 18 Statistics18.1 Sampling18.2 Use Sampling to Draw Inferences (in-class worksheet)18.3 Find the Mean and Range (in-class worksheet)18.4 Understanding Mean and Range (in-class worksheet
Subjects:
Grades:
6th - 7th
Also included in: Math 7 Unit 18 Statistics
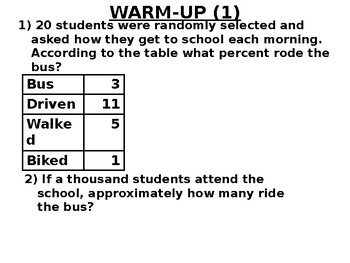
Math 7 18.2 Use Sampling to Draw Inferences
This editable lesson was written by Alex Benn using the concepts described in his book Tenacious-Teaching: Uniting Our Superpowers to Save Our Classrooms and on his website: Tenacious-Teaching.com.NOTE: THERE IS A FREE 18.2 CLASSROOM WORKSHEET THAT ACCOMPANIES THIS LESSON AND ALLOWS STUDENTS TO FOLLOW ALONGUnit 18 Statistics18.1 Sampling18.2 Use Sampling to Draw Inferences18.3 Find the Mean and Range18.4 Understanding Mean and Range18.5 Mean Absolute Deviation18.6 Median, Lower and Upper Quarti
Subjects:
Grades:
6th - 7th
Also included in: Math 7 Unit 18 Statistics
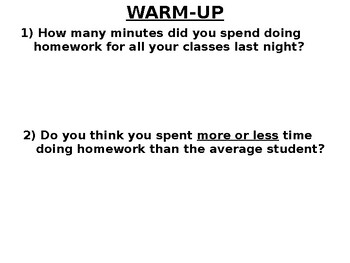
Math 7 18.1 Sampling
This editable lesson was written by Alex Benn using the concepts described in his book Tenacious-Teaching: Uniting Our Superpowers to Save Our Classrooms and on his website: Tenacious-Teaching.com.Unit 18 Statistics18.1 Sampling18.2 Use Sampling to Draw Inferences (in-class worksheet)18.3 Find the Mean and Range (in-class worksheet)18.4 Understanding Mean and Range (in-class worksheet)18.5 Mean Absolute Deviation18.6 Median, Lower and Upper Quartiles (in-class worksheet)18.7 Use Median, Lower a
Subjects:
Grades:
6th - 7th
Also included in: Math 7 Unit 18 Statistics
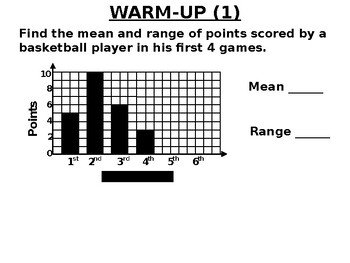
Math 7 18.4 Understanding Mean and Range
This editable lesson was written by Alex Benn using the concepts described in his book Tenacious-Teaching: Uniting Our Superpowers to Save Our Classrooms and on his website: Tenacious-Teaching.com.NOTE: THERE IS A FREE 18.4 CLASSROOM WORKSHEET THAT ACCOMPANIES THIS LESSON AND ALLOWS STUDENTS TO FOLLOW ALONG.Unit 18 Statistics18.1 Sampling18.2 Use Sampling to Draw Inferences (in-class worksheet)18.3 Find the Mean and Range (in-class worksheet)18.4 Understanding Mean and Range (in-class worksheet
Subjects:
Grades:
6th - 7th
Also included in: Math 7 Unit 18 Statistics
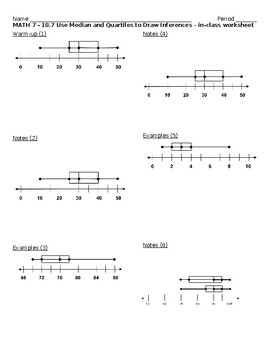
Math 7 18.7 Use the Median and Quartiles to Draw Inferences classwork
This IN-CLASS WORKSHEET accompanies Math 7 Lesson 18.7 Use the Median and Quartiles to Draw InferencesUnit 18 Statistics18.1 Sampling18.2 Use Sampling to Draw Inferences (in-class worksheet)18.3 Find the Mean and Range (in-class worksheet)18.4 Understanding Mean and Range (in-class worksheet)18.5 Mean Absolute Deviation18.6 Median, Lower and Upper Quartiles (in-class worksheet)18.7 Use Median, Lower and Upper Quartiles to Draw Inferences (worksheet)Review Unit 18Test Unit 18
Subjects:
Grades:
6th - 7th
Types:
Also included in: Math 7 Unit 18 Statistics
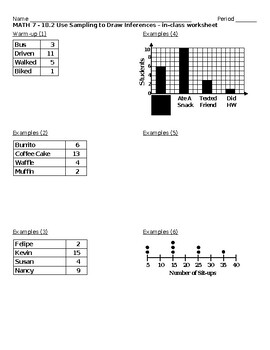
Math 7 18.2 Use Sampling to Draw Inferences classwork
This IN-CLASS WORKSHEET accompanies Math 7 Lesson 18.2 Use Sampling to Draw InferencesUnit 18 Statistics18.1 Sampling18.2 Use Sampling to Draw Inferences (in-class worksheet)18.3 Find the Mean and Range (in-class worksheet)18.4 Understanding Mean and Range (in-class worksheet)18.5 Mean Absolute Deviation18.6 Median, Lower and Upper Quartiles (in-class worksheet)18.7 Use Median, Lower and Upper Quartiles to Draw Inferences (worksheet)Review Unit 18Test Unit 18
Subjects:
Grades:
6th - 7th
Types:
Also included in: Math 7 Unit 18 Statistics
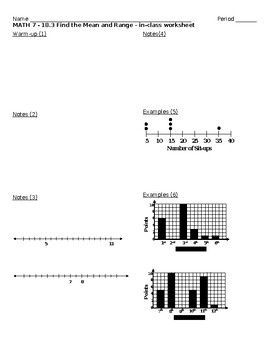
Math 7 18.3 Find the Mean and Range classwork
This IN-CLASS WORKSHEET accompanies Math 7 Lesson 18.3 Find the Mean and RangeUnit 18 Statistics18.1 Sampling18.2 Use Sampling to Draw Inferences (in-class worksheet)18.3 Find the Mean and Range (in-class worksheet)18.4 Understanding Mean and Range (in-class worksheet)18.5 Mean Absolute Deviation18.6 Median, Lower and Upper Quartiles (in-class worksheet)18.7 Use Median, Lower and Upper Quartiles to Draw Inferences (worksheet)Review Unit 18Test Unit 18
Subjects:
Grades:
6th - 7th
Types:
Also included in: Math 7 Unit 18 Statistics
Math 7 18.4 Understanding Mean and Range classwork
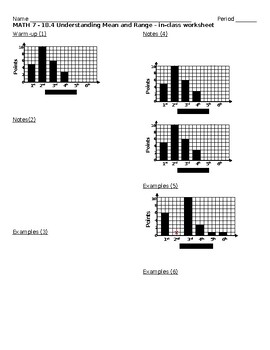
This IN-CLASS WORKSHEET accompanies Math 7 Lesson 18.4 Understanding Mean and RangeUnit 18 Statistics18.1 Sampling18.2 Use Sampling to Draw Inferences (in-class worksheet)18.3 Find the Mean and Range (in-class worksheet)18.4 Understanding Mean and Range (in-class worksheet)18.5 Mean Absolute Deviation18.6 Median, Lower and Upper Quartiles (in-class worksheet)18.7 Use Median, Lower and Upper Quartiles to Draw Inferences (worksheet)Review Unit 18Test Unit 18
Subjects:
Grades:
6th - 7th
Types:
Also included in: Math 7 Unit 18 Statistics
Math 7 Unit 18 Student Self-Evaluation Statistics
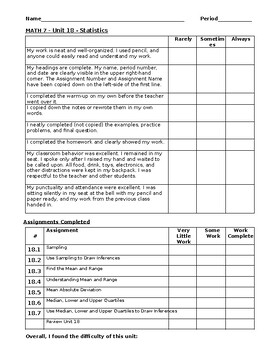
This editable worksheet allows students to reflect on their progress at the end of the unit.Unit 18 Statistics18.1 Sampling18.2 Use Sampling to Draw Inferences18.3 Find the Mean and Range18.4 Understanding Mean and Range18.5 Mean Absolute Deviation18.6 Median, Lower and Upper Quartiles18.7 Use Median, Lower and Upper Quartiles to Draw InferencesReview Unit 18Test Unit 18
Subjects:
Grades:
6th - 7th
Types:
Also included in: Math 7 Unit 18 Statistics
Showing 1-24 of 64 results


