295 results
Study skills statistics resources for Microsoft Excel
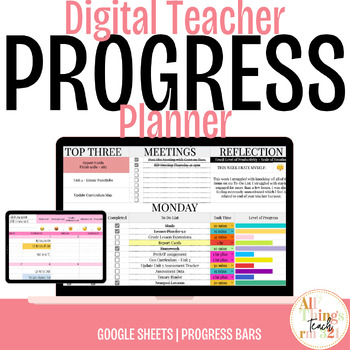
Digital Teacher PROGRESS Planner + FULLY EDITABLE + UNDATED!
Here is my Progress Planner, both a Weekly To-Do Task Tracker and Monthly Calendar which can be used EVERY YEAR. I love this planner so much because it HOLDS ME ACCOUNTABLE. Let's be honest. How many planning tools have we purchased only for a few months later, to be something we discontinue using? Included in this resource is a Digital To-Do list that not only tracks your tasks, but your PERFORMANCE! I created some cool features like an automated color-coded estimated task time to project how l
Grades:
Not Grade Specific
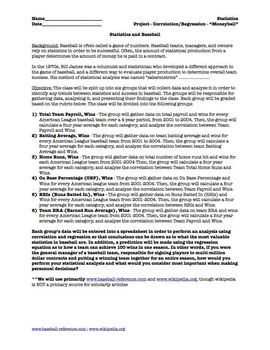
Statistics Correlation and Regression Project for Movie "Moneyball" (5 day)
Prerequisite: Correlation and Regression (Linear). This is a project that divides a statistics class into 6 groups and students do ACTUAL data collection from given websites and they perform their OWN ANALYSIS. They will use computers/internet/excel/spreadsheets/graphing calculators to evaluate correlation. If you have interest in baseball and statistics, this is a great project to get the class interested, and covers about 5 days, plus you can watch the movie "Moneyball" afterwards as a reward.
Subjects:
Grades:
10th - 12th, Higher Education, Adult Education
Types:
12 Days of Christmas: A Computer Spreadsheet Activity
This great holiday activity shows students how to use a computer spreadsheet to calculate the cost of their true love's gifts in today's dollars.The simple step-by-step procedure will allow both beginning and computer-savvy students to experience success as they learn how to use spreadsheet software. Students will enjoy the engaging and entertaining activity. No computer? No problem! Use the activity master so students can calculate the costs themselves.
Grades:
5th - 9th
Types:
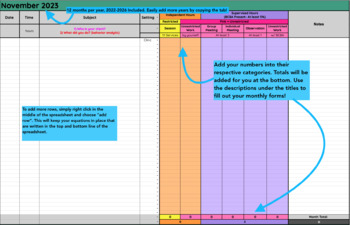
BCBA Trainee Fieldwork Tracker (3+ year) EDITABLE - Color Option 2
This unique documentation system allows BACB trainees the ability to track, document, and calculate hours obtained during their fieldwork experience. Within the tracker are different columns that organize hours into their respective category per the BACB supervision standards. Column totals are automatically added for you and color coded for ease of use in filling out monthly and final forms. Additional rows can easily be added using google sheets formatting.
Grades:
Not Grade Specific
Types:
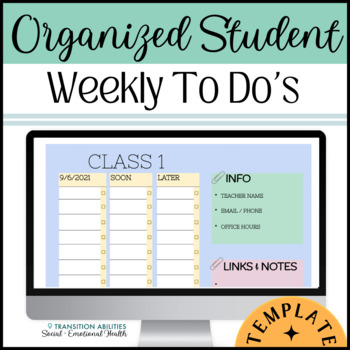
Executive Functioning Support | Google Sheets TO DO Checklist | Back to School
Many students (ADHD, autism, learning disabilities, etc.) struggle with their executive functioning skills, failing to keep track of each “to do” that is required in middle school, high school, and college classes. This digital Google Sheet is a time-saving template meant to help students organize their whole to do list, keep track of important links & contact info, and more! Students can use the weekly view, daily view or class view. They simply type what they have to do, and then check it
Grades:
Not Grade Specific
Types:
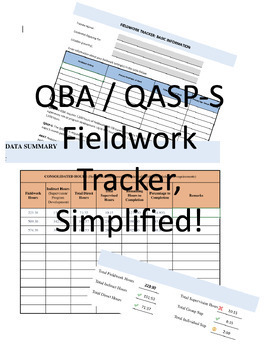
QABA Fieldwork Tracker for QBA and QASP-S v.2.0 (updated 2024 fieldwork req)
Introducing the Ultimate Fieldwork Tracker for Aspiring Behavior Analysts!Streamline your journey towards becoming a Qualified Behavior Analyst or Qualified Autism Service Practitioner-Supervisor with our meticulously designed Excel sheet. This powerful tool empowers you to effortlessly record, track, and analyze your fieldwork hours and experiences.Key Features:Effortless Logging: Quickly input and categorize your fieldwork hours, ensuring accurate and organized record-keeping.Customizable Cate
Grades:
Not Grade Specific
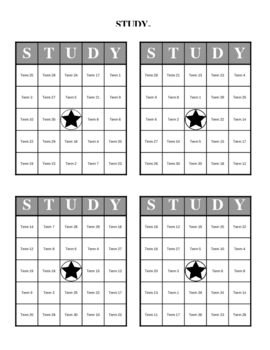
Study Bingo: Print 32 Different Bingo Cards and Master List : (4 Per Page)
This is a great tool that lets you fill in 30 terms and then instantly generates 32 different bingo cards. An example would be to put terms like "George Washington" and "The Declaration of Independence". Then the teacher can use clues like, "He was our first President" or "The document that started the American Revolution". It's easy to use and is very easy to customize. This version prints 4 small Bingo cards per page while the other version prints 2 larger versions per page.Note: You may n
Grades:
3rd - 12th
Types:
Business Analytics 2nd Edition Sanjiv Jaggia, Alison_SOLUTIONS MANUAL
SOLUTIONS MANUAL for Business Analytics, Communicating with Numbers 2nd Edition by Sanjiv Jaggia Professor, Alison Kelly Professor The download file inludes:Complete Chapters 1-18Compressed zip folder INSTRUCTOR MANUAL ALL CHAPTERSR Code GuidePython Guide and SolutionsExcel Spreadsheets and WorkBookSyllabus Undergrad Business AnalyticsSylabus Business Analytics and Data Mining for BusinessAppendix
Subjects:
Grades:
Higher Education, Adult Education, Staff
Types:

BCBA Trainee Fieldwork Tracker (3 year+) EDITABLE - Color Option 1
This unique documentation system allows BACB trainees the ability to track, document, and calculate hours obtained during their fieldwork experience. Within the tracker are different columns that organize hours into their respective category per the BACB supervision standards. Column totals are automatically added for you and color coded for ease of use in filling out monthly and final forms. Additional rows can easily be added using google sheets formatting.
Grades:
Not Grade Specific
Types:
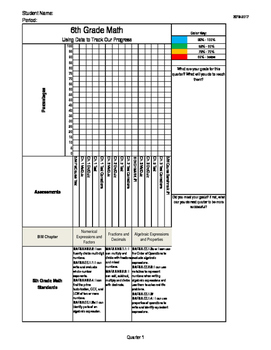
Math Student Data Tracking *EDITABLE*
Created in Excel, an entirely editable document created using pacing guides for Sarasota County, Florida for 6th Grade Mathematics using Big Ideas Math. Includes all standards for 6th Grade Math.
Complete with goal setting and self-assessment "I CAN" benchmark check-ins by Quarter. Workbook includes tracking for the entire year's assessments. Perfect for "data talks" and using data to drive instruction! Ideal for differentiation.
I use this in my students' interactive math notebooks; perfect f
Subjects:
Grades:
4th - 12th
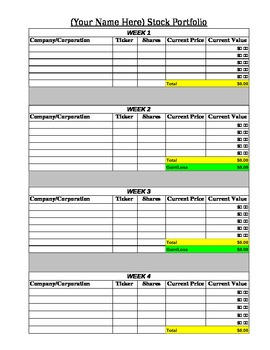
Stock Market Portfolio Tracking Spreadsheet
This document is an Excel spreadsheet which has already been formulated for students to use as part of a Stock Market unit. As students research and track their stocks, they will enter their data into the spreadsheet and their profit/loss will be automatically calculated along with a graph for students to analyze their results.
Subjects:
Grades:
4th - 8th
Types:
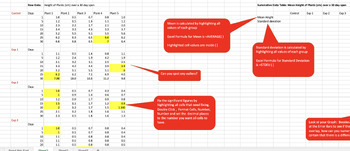
Bundle - Help with Science Fair Table, Graphs, Statistics using Excel.
This comprehensive 3-part bundle comprises a video tutorial, an informative handout, and an Excel file meticulously guiding students through a step-by-step process. The aim is to empower students with the skills to transform raw data into concise summative data tables and graphs, complete with standard deviation error bars. The tutorial covers the entire spectrum – from utilizing Excel for table and graph preparation to conducting statistical analyses using Anova tests, t-tests, or correlation m
Subjects:
Grades:
9th - 12th
Types:
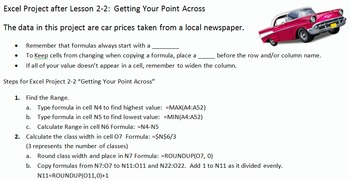
Excel Projects for Statistics Frequency Distributions and Charts
This file contains three different projects with solutions and a quick reference card for students. It correlates to Bluman's Elementary Statistics textbook.
First is an Introduction to Excel. There is an example, guided practice and then 4 Projects. The instructions are on each sheet. The topics covered are: basic editing and formatting, beginning charts, beginning formulas, such as SUM and AVERAGE, and calculations. There is an editable grading rubric for this project. The Preview file
Subjects:
Grades:
8th - 11th, Higher Education, Adult Education
Types:
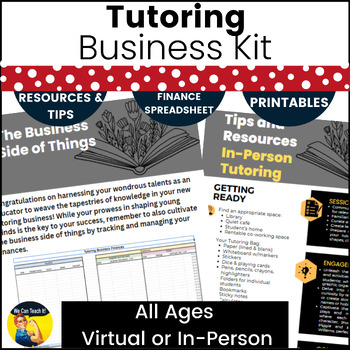
Tutoring Business Kit - All Ages for Virtual and In-Person
Tutoring is a great Summer Side Hustle for teachers! Are you starting a new tutoring service or looking to grow your current business? This set of resources will help you stay organized, plan effective tutoring sessions, and communicate with clients.This resource includes tools and tips for both in-person and online tutoring, no matter what grade or age level students you have. Use this resource again and again with new and current students.This Kit Includes:⭐️ Editable Intro Letter & Contra
Subjects:
Grades:
Not Grade Specific
Also included in: Elementary Tutoring Bundle - Assessment and Business Kit
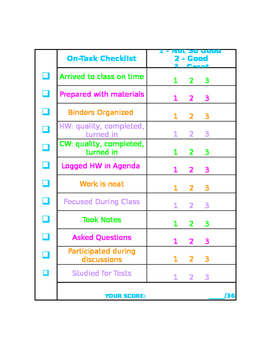
Student On-Task Self-Regulation Checklist
Student On-Task Self-Regulation Checklist
Subjects:
Grades:
3rd - 7th
Statistics Unit 9 Bundle - Hypothesis Testing (one sample) (18 days)
This is a unit plan bundle for a Statistics class. The plans include common core math standards, time frame, activities, enduring understandings, essential questions, and resources used. It is designed to last 18 days, depending on pacing. The plans include: 56-slide presentation, with annotated guide for reference5 Worksheets1 "Read & Respond" Article Worksheet2 Quizzes"Do Now" Entrance problemsSpreadsheet Activity - Hypothesis TestingReview slides (for peer presentations)Unit ReviewUnit Te
Subjects:
Grades:
10th - 12th, Higher Education
Types:
CCSS:
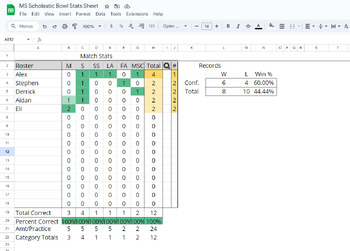
MS Scholastic Bowl / Quiz Bowl Stat Sheet
DISCLAIMER: Made for IESA-Compliant Scholastic Bowl. 24 questions per round, 10 point toss-ups, 4 part bonus (each bonus worth 5 points).This is a stat sheet for MIDDLE SCHOOL Scholastic Bowl/ Quiz Bowl practices and games. It adapts in real-time to update the scoreboard and team totals when a name and category abbreviation is applied (see thumbnails for example) The sheet tracks math, science, social studies/history, language arts, fine arts, and miscellaneous questions. It is incredibly useful
Subjects:
Grades:
6th - 8th
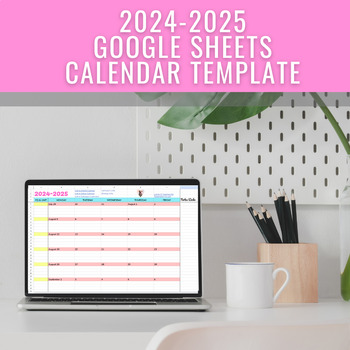
2024-2025 Google Sheets Calendar
Make the switch from Google Docs to Google Sheets for your school year calendar!Here is why I love it:Easy to hyperlinkOne long page instead of multiple page breaksEasy to view on desktop and from your phoneColor coding types of assignmentsCustomizations with different sheets, rows, columns, links, etc.
Grades:
Not Grade Specific
Types:

Ontario Learning Skills Checklist Detailed
Check your students Learning Skills Expectations with a click and a drop down menu of the specific expectation while keeping track of the overall report grade for learning skills.
Subjects:
Grades:
1st - 8th
Types:
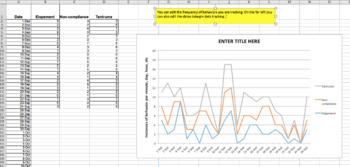
More Graphs Added! Graphing Basic Data For Students: An Excel Workbook
This is a great resource to use for data tracking for all of your students or clients. I have expanded the other Graphic Workbook on my TPT store. This resource is made to easily create graphs for a variety of skills or behaviors. As a result, this excel workbook can be used by teachers, behavior analysts, speech therapists, behavior intervention specialists, really anyone who needs data collection. The graphs can be shared during parent-teacher conferences, IEP meetings, included in student pro
Subjects:
Grades:
Not Grade Specific
Types:
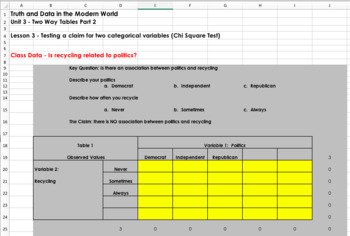
Teaching Statistics with Spreadsheets (Self Grading)
You can see a video that describes the basics of this course at the following link: https://www.youtube.com/watch?v=uZFpltXWyw8This package is an entire statistics course designed for content to be delivered, taught, practiced, and assessed through spreadsheets. Students learn basic statistics and spreadsheet skills. This course is intended to allow for student collaboration and group work throughout the learning process. Each spreadsheet is automatically graded so students can see their progres
Grades:
9th - 12th
Types:
Statistics Unit 8 Bundle - Confidence Intervals (19 days)
This is a unit plan bundle for a Statistics class. The plans include common core math standards, time frame, activities, enduring understandings, essential questions, and resources used. It is designed to last 19 days, depending on pacing. The plans include: 52-slide presentation, with annotated guide for reference5 Worksheets3 Quizzes"Do Now" Entrance problemsSpreadsheet Activity - T-DistributionReview slides (for review response system)Unit test (with review packet)Unit Project - Gather Data,
Subjects:
Grades:
10th - 12th, Higher Education
Types:
CCSS:
VM Numeracy Unit 2 - Civics - Data and Uncertainty
VCE VM Unit 2 Numeracy book, Civic - Data and Uncertainty. This unit looks at odds, reading and interpreting data, probability and statistics. Includes many hands-on activities.
Subjects:
Grades:
10th - 12th
Types:
Also included in: Bundle 1
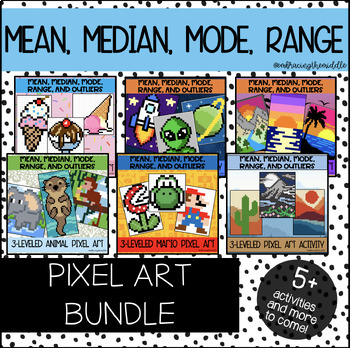
Mean, Median, Mode, and Range Pixel Art BUNDLE for Middle Schoolers | Math
This growing bundle will provide you with 6 pixel art activities that can help deepen student understanding of mean, median, mode, range, and outliers. These pixel art activities have three different levels of knowledge. Gives teachers more flexibility to support individual student needs. This resource can be used in the classroom as a formative assessment, independent classwork, homework, or much more! Students will solve 10 mean, median, mode, and range problems to reveal a mystery image. Give
Subjects:
Grades:
6th - 8th
Types:
Showing 1-24 of 295 results


