605 results
Study skills statistics interactive whiteboards
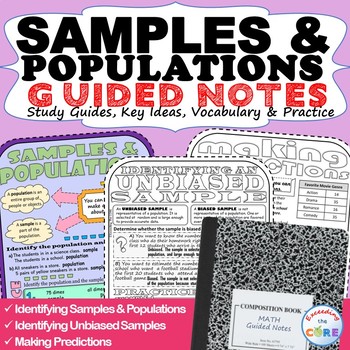
SAMPLES & POPULATIONS Doodle Math - Interactive Notebooks (Guided Notes)
- Great for online learning and distance learning!Have your students use these SAMPLES & POPULATIONS Guided Notes to review key ideas and essential vocabulary . Guided Notes aid in student focus, concept retention, engagement and creativity. Using this resource will allow students to synthesize this math concept and create their own tangible connections in their notes. Guided Notes Includes:__ Key Ideas with Verbal & Numerical Examples__ Essential Vocabulary with Definitions__ Skills Pr
Subjects:
Grades:
6th - 8th
Also included in: 7th GRADE MATH Assessments, Warm-Ups, Task Cards, Worksheets BUNDLE
Guide Words PowerPoint Lesson
Guide Word Fun!
This 31-slide PowerPoint Presentation will offer guidance through the understanding of dictionary guide words, and how they aid students in study skills. Students will learn what guide words are, how they are used, and will practice using their alphabetizing skills in several ways. As a finale, students will be given test prep style practice and two extension activities.
Students will need to know how to alphabetize to the third letter for this presentation.
************
Subjects:
Grades:
2nd - 5th
Also included in: Dictionary Skills PowerPoint Bundle

QAR Game and Practice using Nursery Rhymes.
UPDATED 3/2022This PowerPoint lesson reviews Question Answer Relationships (QAR), and allows students to practice using QAR with well known nursery rhymes that have a twist. The slides give a snippet of a nursery rhyme and then ask students a question. The students do not need to answer the question, but instead need to decide what kind of question of QAR it is. This lesson can be presented on a SmartBoard as an interactive center, or done as a whole group lesson. Included are slides so that
Subjects:
Grades:
3rd - 6th
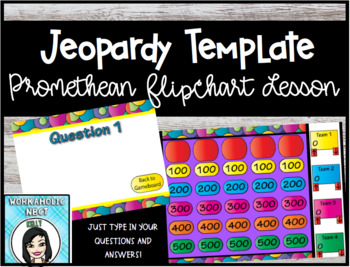
Jeopardy Template Promethean Flipchart Lesson
Do you want to create your own Jeopardy games, but aren't sure how? Now with this neatly designed, bright and colorful template you can make Jeopardy review games for your classroom in a snap! Just add your own categories and questions! Play up to four teams. The arrows underneath each team name keep score by the hundreds with just a click. Use with your voting devices for even more fun! Please make sure that you have Promethean's ActivInspire software installed on your computer before you purch
Subjects:
Grades:
PreK - 12th, Higher Education, Adult Education, Staff
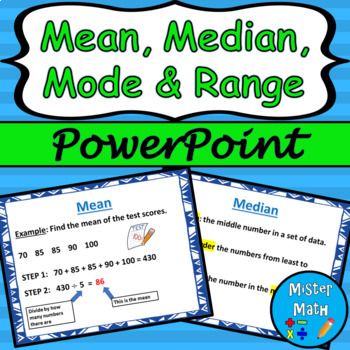
Mean, Median, Mode & Range PowerPoint Lesson
This is a PowerPoint Lesson to assist students in learning about finding the mean, median, mode, and range of data sets. The PowerPoint includes key vocabulary, as well as an example for each skill. Plenty of real-life examples are included to give students ample opportunities to connect the skills to the real world. The presentation also comes fully animated, with animations triggered by mouse click (or presentation pointer!)This PowerPoint lesson is also part of a BUNDLE that includes a guided
Subjects:
Grades:
3rd - 6th
Also included in: Mean, Median, Mode & Range PPT and Guided Notes BUNDLE
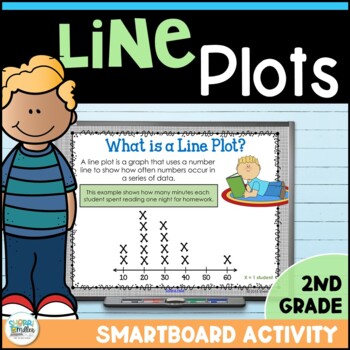
Line Plots Graphing Smartboard Digital Lesson & Student Booklet
Line plots can be a difficult concept for students. This Smartboard lesson and printable booklet will provide you and your students with several activities to practice creating line plots and answering questions about them. The student booklet will keep students engaged during the lesson! You must have Smart Notebook software to open this file. You may also be interested in these other resources:Measurement Digital Escape Room - Escape the Spaceship using Google Apps Geometry Angles Digital Es
Subjects:
Grades:
4th - 5th
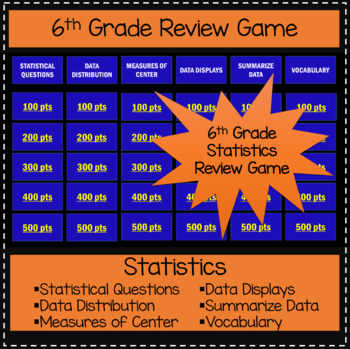
6th Grade Statistics - Game Show Review Game
This is the perfect way to review your 6th grade statistics unit!Students will love this Jeopardy-like game to review the Statistics standards. This game is aligned with Common Core standards. Categories include STATISTICAL QUESTIONS, DATA DISTRIBUTION, MEASURES OF CENTER, DATA DISPLAYS, SUMAMRIZE DATA, AND VOCABULARY. Points range from 100 - 500, which reflect the increase in difficulty from 100-point basic review questions to 500-point questions that require students to apply their knowledge.*
Subjects:
Grades:
5th - 7th
Also included in: 6th Grade Game Show Review Games BUNDLE
Memory Game Concentration Templates for Promethean ActivInspire
Would you like to create fun memory / concentration games for your own classroom easily? This is the flipchart for you!
This flipchart includes ten themed templates for your choosing. Pick a template, follow the simple directions, and add the text to make this game correlate with skills and concepts you are teaching in your classroom. Use these games in stations, centers, for tutoring, and much more.
The ten themed templates that are included within this flipchart are:
* rainbow
* flowers
*
Subjects:
Grades:
PreK - 6th
Types:
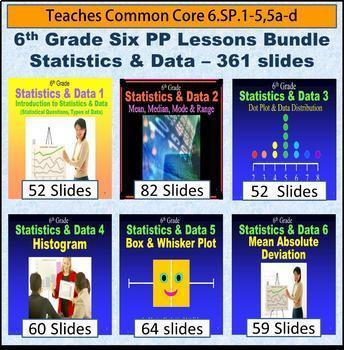
6th Grade Statistics & Data Bundle - 6 Powerpoint Lessons - 402 Slides
Sixth Grade Statistics and Data Bundle - It is composed of 6 different lessons comprising 402 slides on the following: Statistics and Data 1 - Statistical Questions and Types of Data, Statistics and Data 2 - Mean, Median, Mode & Range, Statistics and Data 3 - Dot Plot and Data Distribution, Statistics and Data 4 - Histogram, Statistics and Data 5 - Box and Whisker Plot, Statistics and Data 6 - Mean Absolute Deviation. For more information on these powerpoint lesson click on the individu
Subjects:
Grades:
6th
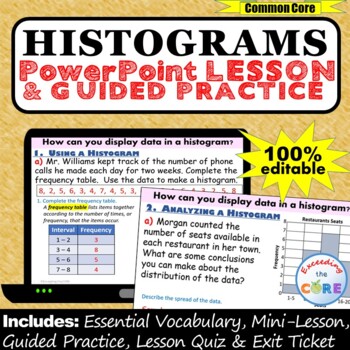
HISTOGRAMS and FREQUENCY TABLES PowerPoint Lesson AND Guided Practice - DIGITAL
Great for online learning and distance learning!Get your students successfully creating and using HISTOGRAMS and Frequency Tables with this PowerPoint Presentation. This lesson begins with a focused mini-lesson and guided practice questions. It concludes with a lesson quiz and exit ticket to assess student understanding. All of the answers are included. This PowerPoint presentation is 100% editable, therefore you can modify any slide as needed.What is Included:_ Mini-Lesson with Guided Practice
Subjects:
Grades:
6th - 8th
CCSS:
Introduction to Probability and Statistics Lesson Plan Bundle
Elementary Statistics - Introduction to Probability and Statistics Lesson Plan BundleThis bundle includes:-Introduction to Statistics and Types of Data-Data Collection, Sampling Techniques, and Studies-Introduction to Technology in Statistics Activity-Organizing Data Using Frequency Distributions-Histograms and Dot Plots-Graphs and Charts in Statistics-Organizing and Presenting Data Using Technology Activity-Measures of Central Tendency-Measures of Position-Measures of Variation-Introduction to
Subjects:
Grades:
10th - 12th, Higher Education
Confidence Intervals and Hypothesis Testing Lesson Plan Bundle
Elementary Statistics - Confidence Intervals and Hypothesis Testing Lesson Plan BundleThis bundle includes:-Confidence Intervals for the Mean-Confidence Intervals for Proportions-Confidence Intervals for Variance and Standard Deviation-Introduction to Hypothesis Testing-Hypothesis Testing for the Mean-Hypothesis Testing for Proportions-Hypothesis Testing forVariance and Standard Deviations-Other Uses of Hypothesis Testing-Confidence Intervals and Hypothesis Testing Test-Confidence Intervals and
Subjects:
Grades:
10th - 12th, Higher Education
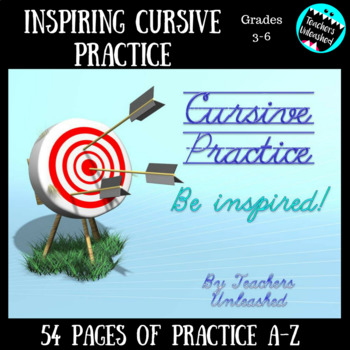
Cursive Practice on PowerPoint
Inspirational Cursive Practice
This is a traditional cursive practice that can be utilized with whiteboards in the classroom, to save yourself from copying those large handwriting workbooks!! Students will see child friendly inspirational quotes from a variety of authors and famous people in history.
Your feedback is so extremely important to us. Thank you so much for rating our products! It's what gets us moving onto the next presentation! We appreciate you and we're happy to be teaching amo
Subjects:
Grades:
3rd - 6th
Measures of Central Tendency (Algebra 2 - Unit 13)
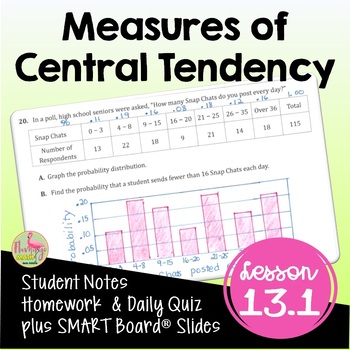
Measures of Central Tendency Algebra 2 Lesson:Your Pre-AP Algebra 2 Honors students will draw, analyze and interpret box-and-whisker plots, find outliers, and calculate measures of central tendency in this unit 13 lesson on Data Analysis & Statistics that cover the concepts in depth. #distancelearningtptWhat is included in this resource?⭐ Guided Student Notes⭐ Google Slides®⭐ Fully-editable SMART Board® Slides⭐ Homework/Practice assignment⭐ Lesson Warm-Up (or exit ticket)⭐Daily Content Quiz
Subjects:
Grades:
8th - 11th, Higher Education
CCSS:
Also included in: Algebra 2 Curriculum Mega Bundle | Flamingo Math
7th Grade Probability 2 - Compound Event Powerpoint Lesson
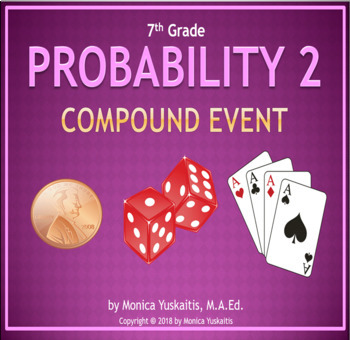
Seventh Grade Probability 2 - Compound Event Powerpoint Lesson is powerful when used as direct instruction in the classroom, on-line, or individually. It teaches the students to find the compound event three different ways: through multiplication, making a tree, and making a list using a table. The following probability terms are taught and reviewed: probability, event, trial, scale of probability, sample space, simple event, experiment, experimental probability. There are 22 effective teac
Subjects:
Grades:
7th
How To Lose Your Job: SMARTboard lesson on Student Success & Soft Skills
How to Lose Your Job: SMARTboard LessonGuidance lesson on the 10 ways to lose your job. This paradox will grab students attention and help them realize that their job is to be a responsible student. They'll also learn tips for success and character traits that help at school and in the work place. Includes fun erase to reveal activities where students use the eraser on the SMARTboard to reveal messages. This lesson is non-editable. Also available in PowerPoint How to Lose Your Job PowerPo
Grades:
4th - 8th
Types:

PowerPoint Game Show Templates for Teachers (Over 20 games!) Zoom GOOGLE Slides
All individual games previously released combined into one zip! - A SUPER VALUEUse these templates with your class to make lessons more engaging and educational. Students love a sense of competition.Each template has the necessary hyperlinks, sounds, and placeholders created for you already (saving you hours). Simply supply your Q&A.Jeopardy Who Wants to be Millionaire Deal or No Deal Are You Smarter than a Fifth-Grader? Plus Many More!
Grades:
K - 12th, Higher Education, Adult Education, Staff, Not Grade Specific
ACT Test Prep Vocabulary PowerPoint
This 101-slide PowerPoint presentation presents 100 vocabulary words, likely to be used on the ACT test. Each slide features one vocabulary word, its definition, and an explanatory sentence or quote using words commonly found in literature, science, social science, and math. The vocabulary may also be found on the SAT or GRE tests. The presentation can be used as a "Word of the Day" activity, or can easily be tailored to meet any teacher's or classroom's needs.
ACT Test Prep by mz applebee i
Subjects:
Grades:
9th - 12th
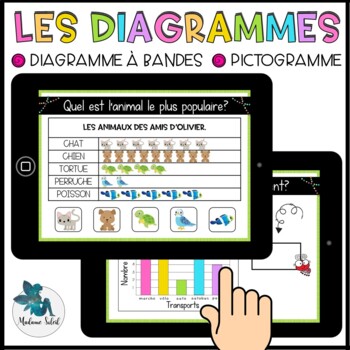
Les diagrammes au 1er cycle Boom Cards French distance learning
French pictograph, french graph. Activité mathématique de statistique permettant de travailler le diagramme, les diagrammes, le pictogramme, les graphiques, l'histogramme ou le diagramme à bande pour des élèves de 1re année, 2e année et 3e année. Super en groupe, en atelier, dans les centres mathématiques, à distance et à la maison. French immersion.Viens l'essayer avant de l'acheter !C'est quoi?20 Cartes Boom dans lesquelles les élèves doivent :- Analyser les diagrammes.- Répondre à la question
Subjects:
Grades:
1st - 3rd
Also included in: Bundle 1re année mai mathématique BOOM CARDS French distance learning
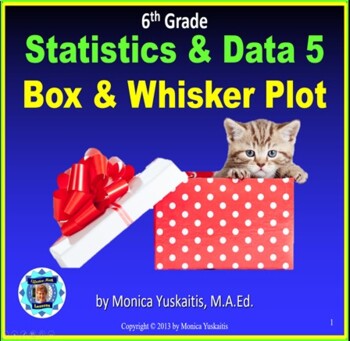
6th Grade Statistics & Data 5 - Box and Whisker Plot Powerpoint Lesson
Sixth Grade Statistics 5 - Box and Whisker Plot Powerpoint Lesson is powerful when used as direct instruction in the classroom, online or individually. It teaches students all the skills necessary to make a box and whisker plot: mean, median, lower quartile Q1, upper quartile Q3, inter quartile range, range, minimum and maximum numbers. Students then are shown how to take this information and build a box and whisker plot. Finally, students are taught how to analyze the box and whisker plot th
Subjects:
Grades:
6th, Adult Education
Also included in: 6th Grade Statistics & Data Bundle - 6 Powerpoint Lessons - 402 Slides
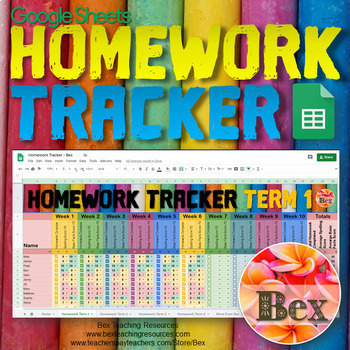
Homework Tracker
Track all your students homework with ease. This easy to use Google Sheet homework tracker is great for making sure your students are keeping up with their homework. Watch a demo here: bit.ly/BexHomeworkTrackerVidIt can be displayed on your classroom projector, TV or shared with students. This a great tool for reporting back to parents. The sheet is fully editable and customisable. It is split into 4 terms each with 10 weeks.US Semester titles provided.Buy in $NZ www.bexteachingresources.com Re
Subjects:
Grades:
2nd - 8th
Probability and Counting Rules Lesson Plan Bundle
Elementary Statistics - Probability and Counting Rules Lesson Plan BundleThis bundle includes:-Introduction to Probability-Addition Rules for Probability-Multiplication Rules and Conditional Probability-Notation and Symbols in Probability-Permutations and Combinations-Application of Counting Rules-Probability and Counting Rules Test-Probability and Counting Rules Quiz (Bonus File)-Sample Space Handout (Bonus File)-Pacing Guide (Bonus File)Preview: Please refer to the above links for additional p
Subjects:
Grades:
10th - 12th, Higher Education
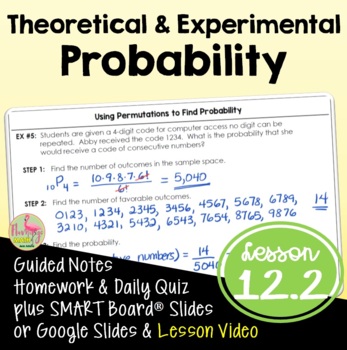
Theoretical and Experimental Probability (Algebra 2 - Unit 12)
Theoretical & Experimental Probability Algebra 2 Lesson:Your Pre-AP Algebra 2 Honors students will find both experimental and theoretical probabilities in this Unit 12 lesson. #distancelearningtptWhat is included in this resource?⭐ Guided Student Notes⭐ Google Slides®⭐ Fully-editable SMART Board® Slides⭐ Homework/Practice assignment⭐ Lesson Warm-Up (or exit ticket)⭐ Daily Content Quiz (homework check)⭐ Video Lesson Link for Distance Learning - Flipped Classroom models⭐ Full solution setStude
Subjects:
Grades:
8th - 11th, Higher Education
CCSS:
Also included in: Algebra 2 Curriculum Mega Bundle | Flamingo Math
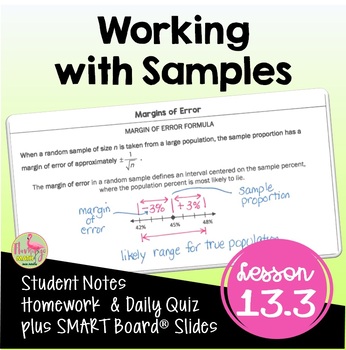
Working with Samples (Algebra 2 - Unit 13)
Working with Samples Algebra 2 Lesson:Your Pre-AP Algebra 2 Honors students will find draw, analyze and interpret box-and-whisker plots, find outliers, and calculate measures of central tendency in this unit 13 lesson on Data Analysis & Statistics that cover the concepts in depth. #distancelearningtptWhat is included in this resource?⭐ Guided Student Notes⭐ Google Slides®⭐ Fully-editable SMART Board® Slides⭐ Homework/Practice assignment⭐ Lesson Warm-Up (or exit ticket)⭐Daily Content Quiz (ho
Subjects:
Grades:
8th - 11th, Higher Education
CCSS:
Also included in: Algebra 2 Curriculum Mega Bundle | Flamingo Math
Showing 1-24 of 605 results


