274 results
Graphing pdfs on sale
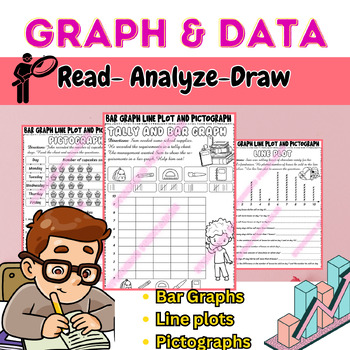
Bar Graphs worksheets, Line Plots, Pictograph, Tally Chart, Data & Graphs 2nd
Bar Graphs, Line Plots, and Pictograph worksheets activities that kids love!Make teaching bar graphs and data much easier and more interactive with this Bar Graph, Line Plots, and Pictograph 2nd grade package. Your kids will love these clean, simple, and vibrant graphing activities. This collection of graphing activities will give your students practice recording, reading, interpreting, and creating bar graphs, pictographs, and line plots. There are also lots of questions to help students analyz
Grades:
1st - 3rd
Types:
NO PREP 5th Grade Geometry G Math Escape Room
Digital Escape Room, 5th Grade Math - Geometry: This no-prep math escape room is a fantastic way to review 5th grade Geometry! Your students will love working together to solve the Geometry-related clues in this escape activity.The escape room is digitally controlled and is perfect for laptops, desktops, iPads, Chromebooks, and tablets of all brands and operating systems! No add-ons, extensions, or extra preparation is required: only the internet browser included on your device. This escape room
Subjects:
Grades:
4th - 6th
Types:
Also included in: 5th Grade Math Escape Rooms NO PREP BUNDLE ★ Digital and Printable

⭐ NO PREP ⭐ Line Plots Escape Room ⭐ 5.MD.2 Activity
Digital Escape Room, 5.MD.2: This no-prep math escape room is a fantastic way to review line plots in 5th grade! Students love working together to solve the clues in this escape activity. The escape room is digitally controlled and is perfect for laptops, desktops, iPads, Chromebooks, and tablets of all brands and operating systems! No add-ons, extensions, or extra preparation is required: only the internet browser included on your device. This escape room integrates seamlessly with Google Class
Subjects:
Grades:
4th - 6th
Types:
CCSS:
⭐ NO PREP ⭐ Numerical Patterns & Graphing Escape Room ⭐ 5.OA.3 Activity
Digital Escape Room, 5.OA.3: This no-prep math escape room is a fantastic way to review graphing and numerical patterns in 5th grade! Students love working together to solve the clues in this escape activity. The escape room is digitally controlled and is perfect for laptops, desktops, iPads, Chromebooks, and tablets of all brands and operating systems! No add-ons, extensions, or extra preparation is required: only the internet browser included on your device. This escape room integrates seamles
Subjects:
Grades:
4th - 6th
Types:
CCSS:

⭐ NO PREP ⭐ Coordinate Graphing Escape Room ⭐ 5.G.1 Activity
Digital Escape Room, 5.G.1: This no-prep math escape room is a fantastic way to review coordinate graphing in 5th grade! Students love working together to solve the clues in this escape activity. The escape room is digitally controlled and is perfect for laptops, desktops, iPads, Chromebooks, and tablets of all brands and operating systems! No add-ons, extensions, or extra preparation is required: only the internet browser included on your device. This escape room integrates seamlessly with Goog
Subjects:
Grades:
4th - 6th
Types:
CCSS:
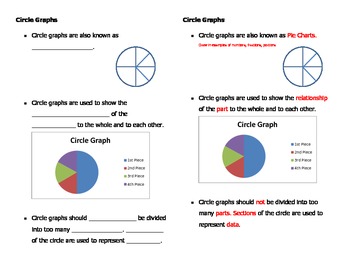
Construct, Compare, Interpret Circle Graphs
Mini Unit: Circle graphs are studied through several guided lessons and independent practice worksheets. Guided notes examine circle graphs and the types of data they represent and are perfect for your interactive notebook. Graphs are constructed to and from a bar graph. Problems involve evaluating and interpreting data through the percents, portions, and fractions represented by graphs. For use in upper elementary and middle school exceptional and general education classrooms.
Subjects:
Grades:
4th - 9th

⭐ NO PREP ⭐ Graph and Interpret Coordinates Escape Room ⭐ 5.G.2 Activity
Digital Escape Room, 5.G.2: This no-prep math escape room is a fantastic way to review coordinate graphing in 5th grade! Students love working together to solve the clues in this escape activity. The escape room is digitally controlled and is perfect for laptops, desktops, iPads, Chromebooks, and tablets of all brands and operating systems! No add-ons, extensions, or extra preparation is required: only the internet browser included on your device. This escape room integrates seamlessly with Goog
Subjects:
Grades:
4th - 6th
Types:
CCSS:
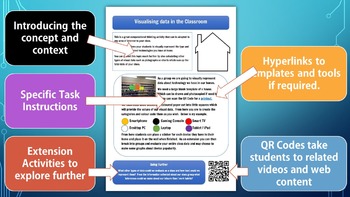
Computational Thinking & Data Analysis Task Cards | STEM | Digital Technologies
Most kids don’t naturally think like PROGRAMMERS, but you can enjoy the satisfaction of seeing them have a COMPUTATIONAL THINKING ⚡“A-ha!”⚡ moment as they learn with these visual, hands-on, NO PREP STEM activities.For those students who learn best by seeing, doing, and getting their hands dirty, this activity and card set will make abstract computing concepts as real as the classroom they’re sitting in. This pack uses students’ everyday interests, such as sports and friends, to teach them how al
Grades:
3rd - 8th
Types:
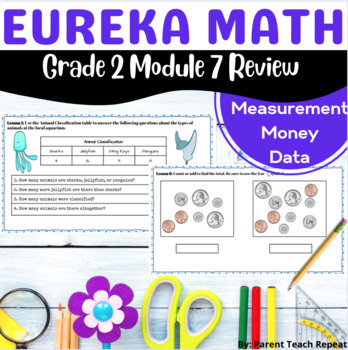
Engage NY {Eureka} Math Grade 2 Module 7 Review Packet Graphing Money Measure
These Eureka Math or Engage NY worksheets review graphing, data, money, and measurement skills following ALL Module 7 lessons for Grade 2. Based on 2nd Grade Common CORE Math Standards, this printable activity is an excellent test review, homework, math center work, teaching example, or if you just don't have time to finish those super long modules. It is an ESSENTIAL resource for homeschooling, tutoring, classroom instruction, intervention or special education instruction. Your math curriculum
Subjects:
Grades:
2nd

⭐ NO PREP ⭐ Line Plots Escape Room ⭐ 4.MD.4 Activity
Digital Escape Room, 4.MD.4: This no-prep math escape room is a fantastic way to review line plots in 4th grade! Students love working together to solve the clues in this escape activity. The escape room is digitally controlled and is perfect for laptops, desktops, iPads, Chromebooks, and tablets of all brands and operating systems! No add-ons, extensions, or extra preparation is required: only the internet browser included on your device. This escape room integrates seamlessly with Google Class
Subjects:
Grades:
3rd - 5th
Types:
CCSS:
Also included in: The EVERYTHING 4th Grade Math Curriculum and Activities Bundle
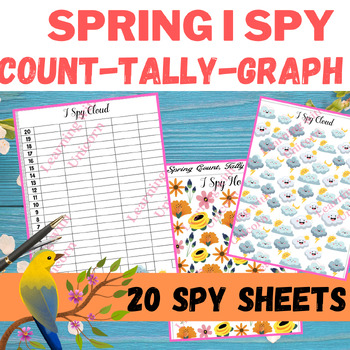
Spring Graphing activities - I Spy, Count, Tally and Graph Sheets
Get engaged with your children with this super colorful and fun I Spy - Count and Graph Spring packet. With the main activities of I Spy, Count, Tally, and Graph, these pages are great for practicing your child's skills in a fun and engaging way. These activities are perfect for learning counting math skills and visual perception. The Spring theme with tons of cute, adorable, and fun items is also a big plus of this packet to attract kids.I Spy Spring themes included: Clouds, Rainbows, Chicks, B
Grades:
K - 1st
Types:
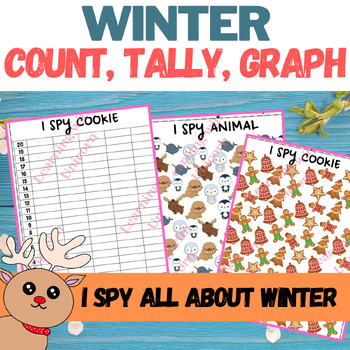
Christmas / Winter Graphing - I Spy & Count and Graph recording sheets
This Christmas / Winter Graphing - I Spy packet is a fun game for your child to practice their one-to-one "count and graph" skills. This packet engages your child with lots of Christmas and Winter themes for I Spy activities and includes graphing pages to count and record the number of items.This "I Spy Christmas Graphing" packet, with a total of 20 pictures, allows you to engage and interact with your child to do some meaningful math while having fun during the busy time of year. They will love
Grades:
K - 1st
Types:
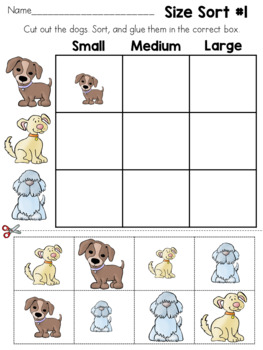
Size Sorting Worksheets - Small, Medium, & Large
Size Sorting Worksheets - Small, Medium, & LargeIn this activity, your students will sort by size. Small, Medium and Large!The themes include cats, dogs, farm animals, and wild animals.All worksheets are in color only. Answer keys are included.Students develop fine motor skills through cutting and gluing.Enjoy!
Subjects:
Grades:
PreK - 1st
Types:
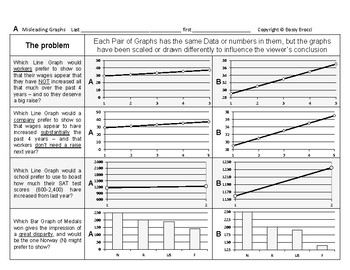
Stats&Data 14: Misleading & Misinterpreting Data Graphs Charts Statistics
This is an excerpt from my popular line ofBossy Brocci Math & Big Science workbooks on Amazon.ANSWER KEY included=======================Students will:1) Analyze 20 different Graphs or Data Displays2) Draw Conclusions & Answer questions about theaccuracy, fairness, limitations & legitimacy of those Graphs3) Answer 16 Multiple-choice questionsbased on their Calculations & Observations4) Be compelled to show their work in a neat & orderly format5) Be trained to methodically &
Subjects:
Grades:
Not Grade Specific
Types:
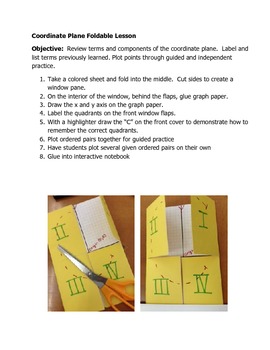
Coordinate Plane Unit
Coordinate Plane unit, including guided notes, foldable, and activity. Guided notes discuss vocabulary with helpful hints and strategies. Foldable reviews vocabulary and offers students guided and independent practice graphing ordered pairs. The foldable can be glued into an interactive notebook for reference. The activity creates a drawing using given points and student determined points. This resource is recommended for the general and special education classroom for middle and secondary sc
Subjects:
Grades:
5th - 9th
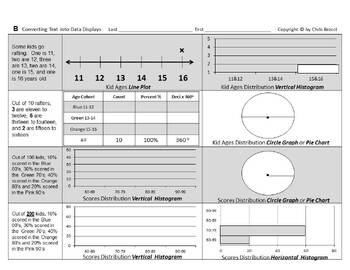
Stats&Data Bundle C: Data Displays Measures of Central Tendency & Variation
From the Author of Bossy BrocciMath & Big Science workbooks on Amazon,this Bundle of Data Displays,Measures of Central Tendency(Mean, Median, Mode & Range);and Measures of Variation(Quartiles, Interquartile Range, Outliers & Box Whisker plots)contains:11 Lessons32 Worksheets832 Problems & Tasks- and Assessment up the a$$=======================Answer KEYS included=======================Coverage Specifics:#1 Identify & Select Common Typesof Data DisplaysStudents will:1) Identi
Subjects:
Grades:
Not Grade Specific
Types:
Create Your Own Bar Graph Project
Students will brainstorm topics they could use to create a survey and bar graph. They will then pick one of the topics and create a survey. After creating a survey they will collect data from classmates. When they have collected data in a tally chart, they will make a bar graph. There are also pages in which students need to write questions that can be answered using their bar graph and then space for students to solve the questions for an answer sheet. My students had a lot of fun with this act
Subjects:
Grades:
1st - 4th
Types:
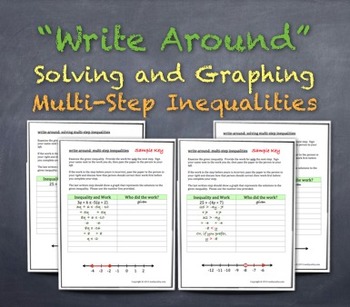
"Write-Around" Solving & Graphing Multi-Step Inequalities ENGAGE ALL STUDENTS!
"Write-Around" is a strategy I enjoy using when Algebra becomes "multi-step"! Groups of no more than 5 students are given these sheets such that every student starts with a different problem.
Each student solves ONLY the NEXT step of the problem, passing the paper on to the next person to complete the NEXT step. Detailed instructions are on the top of each of these "Write-Around" sheets.
Very often, I will choose one problem from each group to actually grade, warning the students ahead of ti
Grades:
6th - 9th
Types:
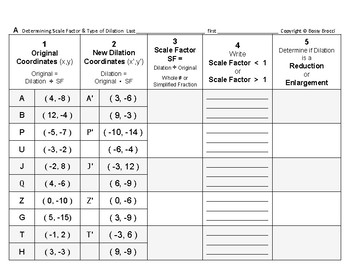
Transformations 16: Dilations - Calculate Scale Factors & Write Type of Dilation
This is an excerpt from my popular line ofBossy Brocci Math & Big Science workbooks on Amazon.Answer KEY included=======================Students will:1) Calculate and Write 10 Missing Scale Factorsfrom NON-graphical (i.e. just numerical) Original and Dilation Coordinates2) Convert Scale Factors to eitherWhole Numbers or Simplified Fractions3) Determine and Write whether‘Scale Factor is < 1’ or ‘Scale Factor is > 1’4) Determine and Write if the Dilation is a‘Reduction’ or ‘Enlargement’5
Subjects:
Grades:
Not Grade Specific
Types:
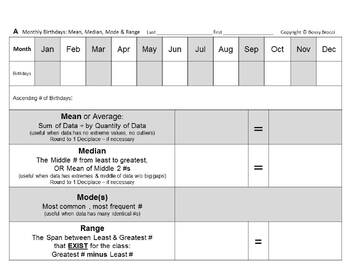
Stats&Data Bundle B: Birthdays Data Displays Variation Mean Median Mode Range
From the Author of Bossy BrocciMath & Big Science workbooks on Amazon,this Birthdays Stats (Mean, Median, Mode, Range),Measures of Variation & Data Displays Bundlecontains:2 Lessons12 Worksheets294 Problems & Tasks- and Assessment up the a$$=======================Answer KEY included=======================Coverage Specifics:#1 Author's Numbers Birthdays ProjectStudents will:1) Convert the given Monthly Birthdaysfrom Mr. Brocci's School numbers into:Ascending List/Data SetMeanMedianMod
Subjects:
Grades:
Not Grade Specific
Types:
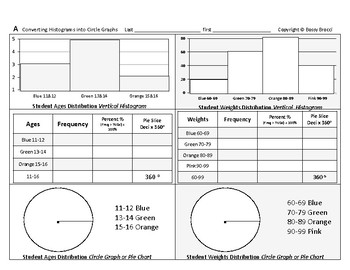
Stats&Data 03: Convert Histograms into Circle Graphs Construct Create Pie Charts
This is an excerpt from my popular line ofBossy Brocci Math & Big Science workbooks on Amazon.Answer KEY included=======================Students will:1) Convert 3 Vertical Histograms into3 Data Tablesand3 Colored or Shaded Circle Graphs (Pie Charts)2) Convert 1 Horizontal Histogram into1 Data Tableand1 Colored or Shaded Circle Graph (Pie Chart)3) Be compelled to show their work in a neat & orderly format4) Be trained to methodically & systematicallyPresent Data in different DisplaysN
Subjects:
Grades:
Not Grade Specific
Types:
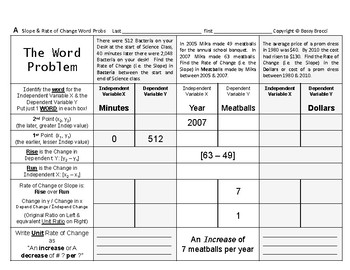
Pre-Graphing 17: Calculate Slope as a Rate of Change from Word Problems
This is an excerpt from my popular line ofBossy Brocci Math & Big Science workbooks on Amazon.====================Students will:1) Solve 6 Rate of Change or Slope Word Problems by identifying & Writing the Independent and Dependent-Variable Data pairs or Points, and Solving for Rate of Change using the 2-Point Slope Formula2) Write the Unit Rate of Change as a Complete Sentence 3) Be compelled to show their work in a neat & orderly format4) Be trained to solve Rate of Change Word Pro
Subjects:
Grades:
Not Grade Specific
Types:
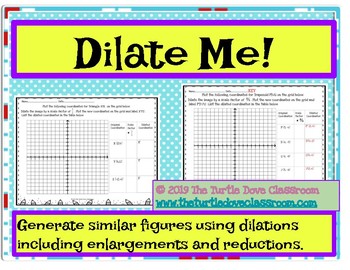
Middle School Math Center: Similar figures using dilations on a graph and table
Your students will practice hands on graphing with 4 different figures, rectangle, triangle, pentagon, trapezoid, plus a fill in the blank graph so you are able to make your own figure. I have also included a fill in the blank graph and table so you are able to use it as a assessment or exit ticket for your class. you may also use the fill in the blank graph for guided notes or whole class examples. Answer key is included. Visit my blog for more math stations ideas. www.theturtledoveclassro
Grades:
7th - 10th
Types:
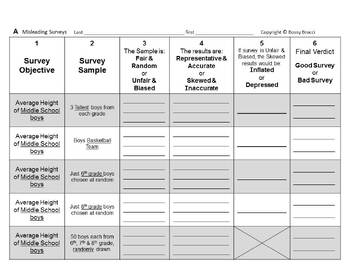
Stats&Data Bundle D: Misleading Misinterpreting Surveys Statistics Graphs Charts
From the Author of Bossy BrocciMath & Big Science workbooks on Amazon,this Bundle onMisleading & MisinterpretingSurveys, Statistics, and Graphs/Chartscontains:2 Lessons8 Worksheets78 Problems & Tasks- and Assessment up the a$$=======================Answer KEYS included=======================Coverage Specifics:#1 Misleading & Misinterpreting Surveys & Statistics+ QUIZStudents will:1) Read 10 different Surveys and Survey Samples2) Determine and Write if those Surveys are:Fair
Subjects:
Grades:
Not Grade Specific
Types:
Showing 1-24 of 274 results


