34 results
Free graphing worksheets for Easel Activities
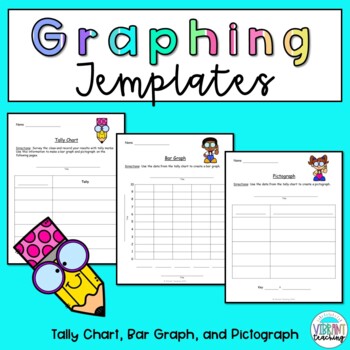
Graphing Templates: Tally Chart, Bar Graph, and Pictograph
Use these graphing templates to create a tally chart, bar graph, and pictograph. Students will be so excited to choose a topic, complete a survey, and record their data on these graphs. Each activity comes in color and black and white. The color copy is great to project on the board to do a class example first.Digital Learning:Includes a digital version using the TPT Digital Activity Tool. Text boxes have already been inserted so students can easily type their responses. You can also edit the
Grades:
1st - 3rd
Types:
Also included in: Graphing Worksheets: Tally Chart, Bar Graph, and Pictograph
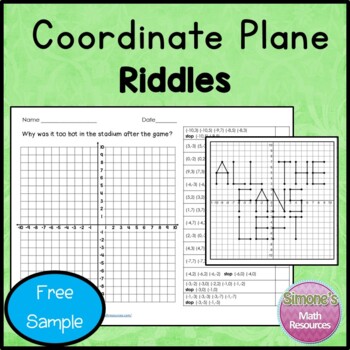
Coordinate Grid Riddles Free Sample
Are you looking for a fun way to practice plotting points? Solving riddles is highly motivating and self checking.*** This free sample comes from the following product***Coordinate Grid Riddles (Four Quadrants) Get more riddles in the full version. *****************************************************************************More Riddles:Coordinate plane (one quadrant)Exponents DecimalsOrder of OperationsFractionsMore Coordinate PlaneBingoI have, who has?Flash Cards or Task CardsGuided Lesson***
Grades:
5th - 6th
Types:
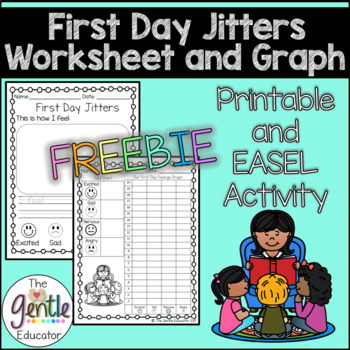
First Day Jitters Worksheet and Graph - Printable and EASEL Activity
These are two worksheets that can be used on the first day of school to use to supplement the book, First Day Jitters by Julie Danneberg.The first worksheet allows the students to select how they are feeling out of the four choices. The visuals above the words supports ELLs and students with special needs. After the students circle their feeling, they will complete the sentence starter by writing the word how they feel on the dotted line. After students complete their sentence, they will illustr
Subjects:
Grades:
PreK - 2nd
Types:
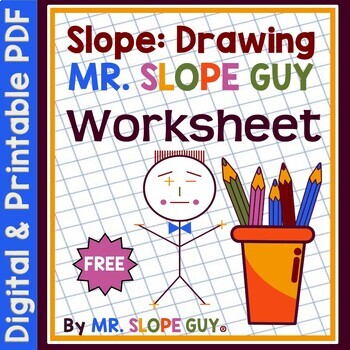
Slope Drawing Mr. Slope Guy FUN and FREE Worksheet`
Hello Math Teachers! This is a fun activity where students use positive, negative, vertical, and horizontal lines to create the character called “Mr. Slope Guy”. Students follow step by step instructions using colored pencils to draw a stick figure with certain conditions, and then answer a few questions relating the picture to key slope concepts. My 8th grade PreAlgebra students love it. They find it a short, fun, and easy activity. One page pdf worksheet with 14 steps / questions, and key.Ma
Grades:
7th - 8th
Types:
Also included in: Finding Slope Worksheets Bundle

Line Plot Freebie
In this freebie you will find one line plot sample, one blank line plot, and measurement line plots. This product was specifically designed for grade 3 however can be used for other grades. Please do not rate this product low or leave unkind feedback as it is free.Domain: Measurement and Data (MD)Cluster: Represent and interpret data.Standard: 3.MD.4. Generate measurement data by measuring lengths using rulers marked with halves and fourths of an inch. Show the data by making a line plot, where
Subjects:
Grades:
3rd
Types:
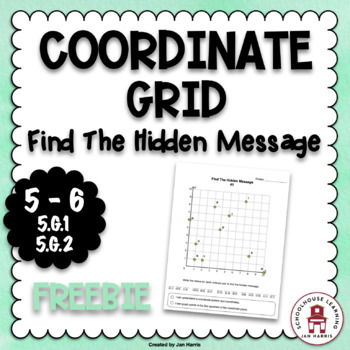
COORDINATE GRID - Find The Hidden Message
Your students will have fun practicing graphing points in the first quadrant with this worksheet. This product is aligned to the common core.Please leave feedback. Your comments are always welcome and appreciated!Follow me for more great products at great prices!My TpT Store - Jan Harris
Grades:
5th
Types:
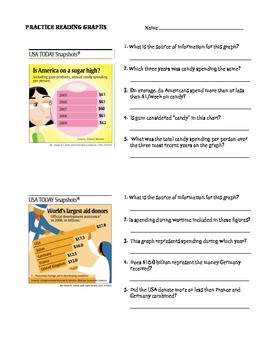
Practice Reading Graphs: USA Today FREEBIE, DISTANCE LEARNING, EASEL ACTIVITY
*** UPDATED FOR DISTANCE LEARNING***Assign to your students via Google Classroom, Answer boxes are already provided for your students to input their answers. The Answer Key has been removed in the digital activity, but you can still access it in the pdf version.This digital activity presents 4 graphs from the popular "USA Today Snapshots" to provide practice with all aspects of reading graphs (3 bar graphs, 1 pie chart) - interpreting data, drawing conclusions, recognizing sources, etc. Th
Subjects:
Grades:
6th - 9th, Adult Education
Types:
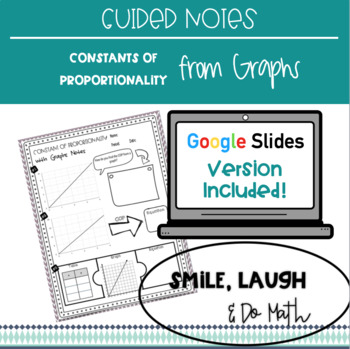
The Constant of Proportionality from Graphs - Guided Notes
These guided notes help students to find the constant of proportionality from graphs as well as translate between formats (equations, tables and graphs). These notes focus on the following skills: Finding the constant of proportionality in graphs Writing an equation from a graph Translating between graphs, equations and tables. What's included: 1 page of guided notes (printable) 1 page of guided notes (digital version on Google Slides) **Note: You will have to first make a copy and then distribu
Grades:
7th - 8th
Types:
Counting and Sorting - Recording and Graphing
Counting, sorting, recording and bar chart worksheets for ice cream flavors and colors. The recording sheet title has been left blank so you can choose to create tick, tally or picture charts.The sheets could also be used to complete class surveys.This could be used alongside another resource in store:ICE CREAM TALLY CHART ACTIVITYDigital Version Also Available:Alongside the worksheet version of this resource there is now a digital version for which instructions and answer boxes are already in p
Grades:
K - 1st
Types:
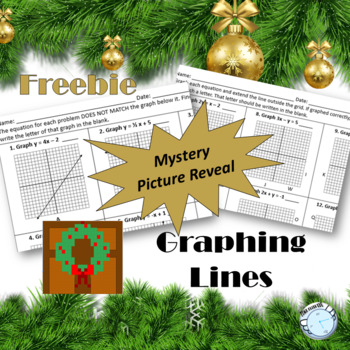
Graphing Lines Freebie
This easy no-prep freebie has 12 problems where students will:Recognize a graph and match it with a linear function written in slope-intercept form (this is a bit tricky…an equation is not matched up properly and the student will need to find the correct one.)Graph a linear function from slope-intercept form or another form. (After graphing, a letter will be associated with the correct line and will be written in the blank for easy grading.)*For an extra layer of fun during the holidays, there i
Grades:
8th - 10th
Types:
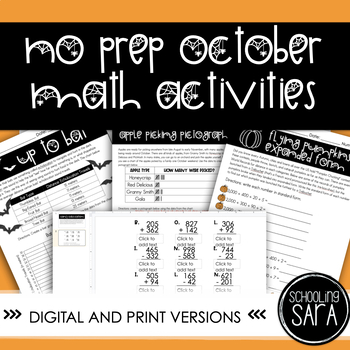
Fall/Halloween No Prep 3rd Grade Math Activities (digital and print) VA SOL
This is a set of printable or digital worksheets that revolve around traditional aspects of Fall and October while also tackling math activities. They are aligned to the Virginia (VA) SOLs for 3rd grade, but work for anyone doing addition and subtraction, graphing, or expanded form. All you need to do is print them off and let your students work - and each activity comes with tidbits of information about a specific October topic, whether it’s apples, candy or bats. Each page also has an answer k
Subjects:
Grades:
2nd - 3rd
Types:
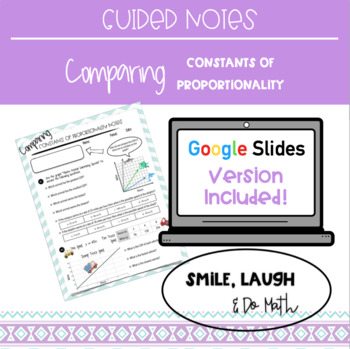
Guided Notes: Comparing the Constants of Proportionality
These guided notes help students to compare constants of proportionality primarily from graphs.These notes focus on the following skills:Determining the largest/smallest constant of proportionality from looking at a line's steepness Finding the constant of proportionality in graphs, equations and tables Answering questions about a graph (such as which is faster or slower) What's included:1 page of guided notes (printable)1 page of guided notes (digital version on Google Slides) **Note: You will
Grades:
6th - 8th
Types:
CCSS:
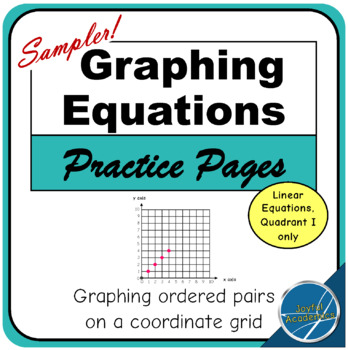
Graphing Equations on a Coordinate Grid - FREE Sampler
Practice graphing linear equations on a coordinate grid in Quadrant I only, so students can explore graphing equations without prior knowledge of negative numbers. This is a free sampler of the full product: Graphing Equations on a Coordinate Grid.Equations are presented in y = mx + b form, starting with graphing y = x. Each page is designed to provide practice graphing equations AND to spark discussion about the patterns to be discovered in these graphs of linear equations.This sampler includes
Grades:
5th
Types:
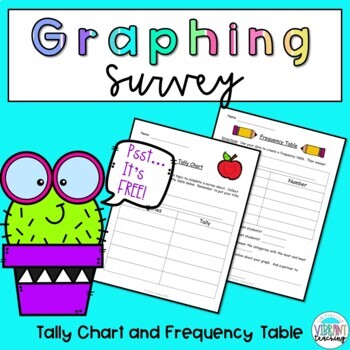
Graphing Survey: Tally Chart and Frequency Table
Fun graphing survey that includes a tally chart and frequency table template. You can either assign a topic to students or let them create their own. This will enable them to collect data and show their results in various ways. At the conclusion students will answer questions to interpret the information. Then they can create their own question and trade with a partner to have them answer it. Digital Learning:Includes a digital version using the TPT Digital Activity Tool. Text boxes have al
Grades:
1st - 3rd
Types:
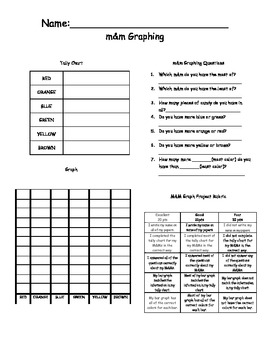
2nd Grade m&m Graph Activity
Students use the candy to make a tally chart and graph. The students answer questions about the candy. A rubric is provided to grade the activity.
This work is licensed under a Creative Commons Attribution-NoDerivs 3.0 Unported License.
Liscence is per user. One teacher can distribute to one class.
Subjects:
Grades:
2nd - 3rd
Types:
Also included in: Math 2nd Grade Choice Boards, Worksheet, Activity, Standard Bundle
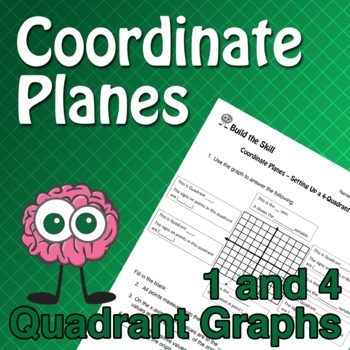
Build the Skill - Coordinate Planes
These activities correspond with the Coordinate Planes videos playlist on our YouTube Channel (https://bit.ly/3hHmLW7)Students can learn how to set up, read and plot points on both a 1- and 4-quadrant graph. Videos can be accessed via the QR code on each page. All answers are in the corresponding video, so you could use this as a self-guided activity.
Subjects:
Grades:
4th - 8th
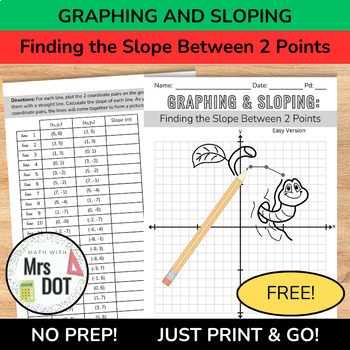
*FREEBIE* Graphing & Sloping Activity - Finding the Slope Between 2 Points
Dive into the 'Graphing and Sloping' activity, a math art adventure in finding slope and graphing points. This engaging math mystery picture task allows students and educators to explore slopes from two points, tables, and graphs, bringing math to life through creative expression.Drawing inspiration from the beloved "Mystery picture worksheets," our "Graphing and Sloping" activity takes this concept to a higher level. This activity aims to not only reinforce core mathematical principles but also
Subjects:
Grades:
8th - 12th
Types:
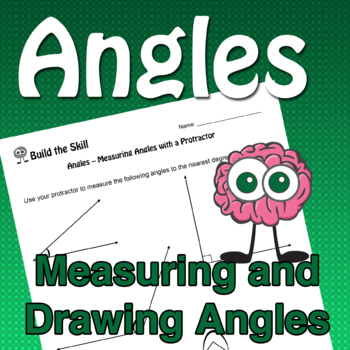
Build the Skill - Angles
These activities correspond with the Angle videos playlist on our YouTube Channel (https://bit.ly/31CeNrA) Students can learn how to measure and draw angles using both a protractor and an angle ruler. Videos can be accessed via the QR code on each page. All answers are in the corresponding video, so you could use this as a self-guided activity.
Subjects:
Grades:
4th - 8th
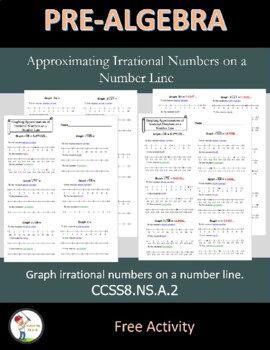
Graphing Approximations of Irrational Numbers
Students will make approximations of irrational numbers and then graph them on the following number lines: a) whole numbers b) tenths c) hundredths.The product contains:12 Irrational numbers (most include square roots) to graph on a number lineA number line numbered by ones for the student's first estimate.A blank number line for students to number by tenths for their second estimate.A blank number line for student to number by hundredths for their third and final estimate.This product can easil
Grades:
8th - 10th
Types:
CCSS:
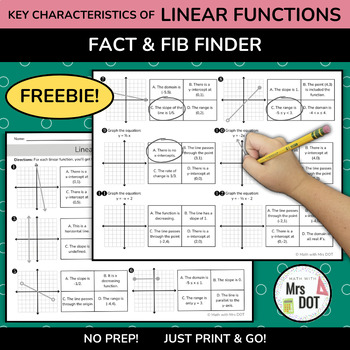
*FREEBIE* LINEAR Function Fact & Fib Finder | Key Characteristics of a Function
Dive into "Function Fact & Fib Finder," a concise activity focused on linear equations and functions. Engage with key characteristics like domain, range, and intercepts, while graphing linear equations. This linear functions activity enhances understanding of linear relationships through interactive and practical exploration.Drawing on the classic concept of 'Two Truths and a Lie,' the "Function Fact & Fib Finder" elevates this approach to a new educational plane. It is designed not just
Subjects:
Grades:
8th - 11th
Types:
CCSS:
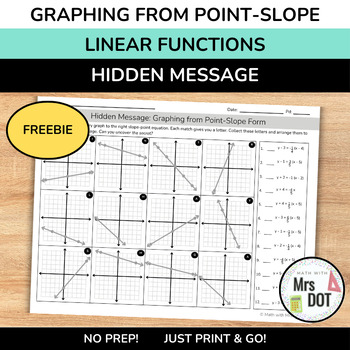
*FREEBIE* Hidden Message: Graphing from Point Slope Form Activity
Discover our "Point Slope Form Activity," featuring engaging graphing worksheets, linear equations challenges, and matching activities to enhance graphing skills through interactive graphing activities and exercises.Unveil the mysteries of algebra with "Hidden Message: Graphing from Point-Slope Form," a captivating educational activity crafted for both middle and high school students. This unique tool bridges the excitement of a puzzle with the critical principles of algebra, turning the learnin
Subjects:
Grades:
8th - 11th
Types:
CCSS:
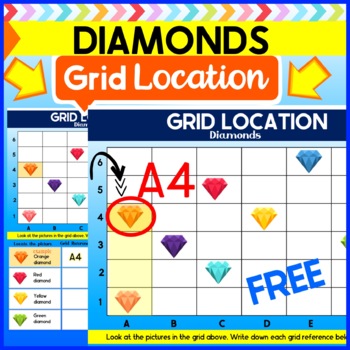
FREE Grid Location digital worksheet (Diamonds grid reference activity)
FREE Colourful Diamonds- Grid Reference digital work sheet☆ Before purchasing any of my other Grid reference worksheets you can check out this Free version first!#FridayFreebiesThis Activity was designed for use with Easel by TPT. NOTE:This activity was purposefully designed to be compatible with Easel in the online digital/distance/online learning space! A PDF however is also included in order for printable use within a classroom setting.THIS ACTIVITY....This activity comes in 2 formats. A PDF
Subjects:
Grades:
K - 3rd
Types:
Also included in: Grid Location worksheets (10 topics- Grid Reference) Value Bundle!
Bar Graphs Slides
Bar Graph Slides can be easily used as a slide activity for students. This is also a great resource for teachers to use as a whole group activity engaging all students. Bar Graph Slides can be adapted into many cooperative learning structures.
Grades:
K - 2nd
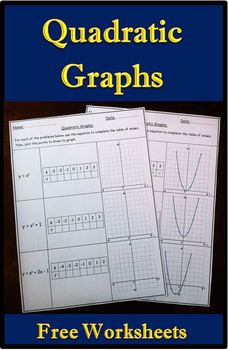
Quadratic Equations - Graphs
This is a worksheet activity asking the students to use the given equations to complete a table of values and plot the points on a graph.There are two worksheets and two answer sheets included.Digital Version Also Available:If you decide to use this version of the resource, instructions and answer boxes are already in place but please feel free to add your own instructions and edit/adapt these features if you wish.Please don't hesitate to contact me if you have any further questions.
Subjects:
Grades:
9th - 11th
Types:
CCSS:
Showing 1-24 of 34 results


