231 results
6th grade Earth Day graphing study guides
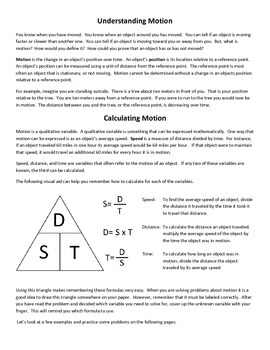
Calculating Speed, Time, Distance, and Graphing Motion - Distance Time Graphs
This activity is centered around the concept of motion. This activity defines motion and gives instruction and examples on how it cat be calculated and graphed. This activity includes informational text on calculating and graphing motion as well as a variety of problems to check for understanding. There are problems that involve solving for speed, distance traveled, and time in motion. Distance vs. Time and Speed vs. Time graphs are discussed. Twelve distance vs. time graphs and twelve spe
Subjects:
Grades:
4th - 9th
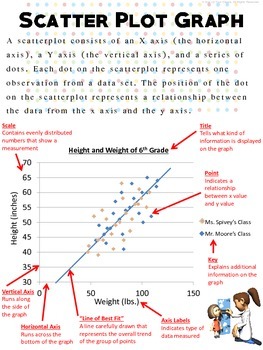
Scatter Plot Graphing: How-To Printable
These printables help students read scatter plots, data, and charts that display gathered numbers visually. It includes the following:
-An informative model scatter plot graph
-Data tables to be completed
-Analysis questions to answer after reading graphs
-Whole scatter plots to be created on their own
This would be a huge help in science class to teach how to display gathered data via scatter plots. It could also be used in math class when covering graphs. Enjoy!
BUY THE WHOLE GRAPHING BUND
Grades:
5th - 9th
Learning from The Lorax Conservation Mini Course CCSS Grades 3-6 Print and Go
Introducing the Lorax Conservation Mini Course: Celebrate Earth Day and Arbor Day with a learning experience that combines reading, writing, art, vocabulary, and economics. This comprehensive mini course is designed to inspire students to think critically about environmental conservation.Key Features:Comprehension Guide: A two-page guide helps students explore the world of "The Lorax" and its themes.Resource Identification Activity: Students categorize resources (capital, human, natural) to rein
Subjects:
Grades:
3rd - 6th
NGSS:
K-ESS3-3
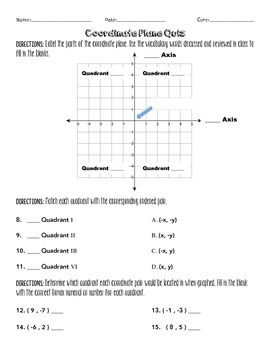
Coordinate Plane Quiz
The Wright Ladies present a coordinate plane quiz. Great review for students to check understanding of the basics of the coordinate lane and graphing points.
Included in this download is a PDF version of the formative assessment and answer key.
Grades:
4th - 10th
Ratios and Proportions Study Guide and Assessment {6.RP.1, 6.RP.2, 6.RP.3}
Have you been looking for some extra practice or an assessment for Ratio and Proportion Standards? These activities are perfect! The questions are thought provoking and ask students to think deeply about ratios and proportions and their relationships. The file contains a study guide that would also work great as a pre-assessment to your teaching and a longer assessment for an end of the unit test. You could also use these materials as some extra practice to reinforce skills. The answer key gives
Subjects:
Grades:
5th - 7th
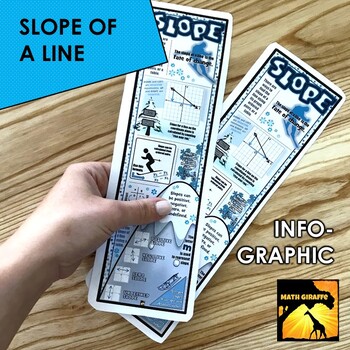
Slope Infographic
Slope of a Line - Main Ideas for Slope:This is a great study guide or graphic organizer for students working with linear equations and learning how to find slope. The infographic contains main ideas about slopes of lines. These infographics are intended to be printed two-per-page. You can cut each one out individually and use as a bookmark or study guide. You can also 3-hole punch as a half sheet for student binders. Take a look at the preview file to see the layout. *** This item is also a
Grades:
6th - 9th
Types:
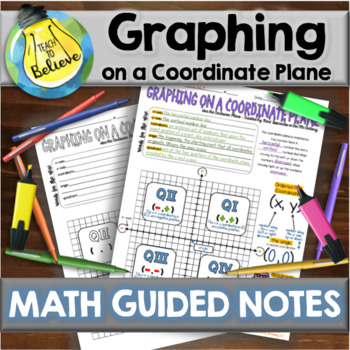
Graphing on a Coordinate Plane - Guided Notes
Graphing on a Coordinate Plane - Guided NotesThis set completely covers the parts of the coordinate plane and how to graph a coordinate. What is Covered:-Coordinate Plane Terminology-Quadrant Specifics-How to Graph a CoordinateWhat's Included:-Blank Student Copy-Typed Colorful Key-Completed Student SampleHow to Use This Product:After students have completed these guided notes, it is best for them to keep them in sheet protectors in a math folder. You can download a FREE blank table of contents f
Grades:
4th - 7th
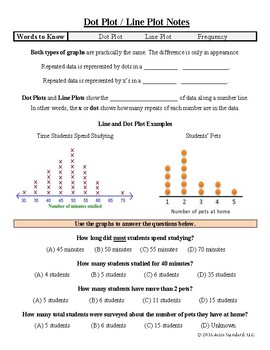
Dot Plots and Data Distribution Notes
A visually appealing and interactive way to teach about dot plots, line plots and the distribution of data. Both reading and creating dot/line plots is addressed on the first page of the notes. The entire second page is dedicated to describing the shape of the data. From bell curves to skewed left or right, dot plots are used to describe statistical elements of data sets.
Actis Standard notes are a great way to teach students how to take notes in an easy to follow fill-in-the-blank format. Comp
Subjects:
Grades:
5th - 7th
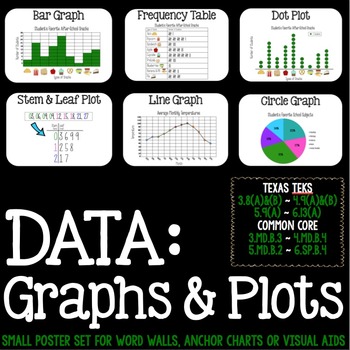
Math Vocabulary: Stem & Leaf, Dot Plots, Frequency Tables
This small poster set (each print out is 6.5 x 9.5) includes visual examples for:
- Bar Graph
- Frequency Plot
- Stem and Leaf Plot
- Circle Graph
- Line Graph
- Dot Plot
Great for word walls, anchor charts or visual aids in your classroom!
Subjects:
Grades:
3rd - 6th
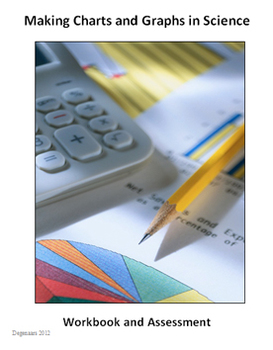
Making Science Charts and Graphs
A simplified look at making charts and organizing data in science.
-Data Charts
-Circle Graphs
-Bar Graphs
-Line Graphs
-Key Vocabulary List
-Quiz/Assessment
-Activity - Practice
-Teacher answer key for quiz and activity
Thanks for taking the time to stop by my store!
Mrs. Degs
Teaching Science Well
Blog: http://teachingsciencewell.wordpress.com/
Facebook: https://www.facebook.com/TeachingScienceWell
TPT: http://www.teacherspayteachers.com/Store/Teaching-Science-Well-Science-Resources
Pi
Subjects:
Grades:
3rd - 10th
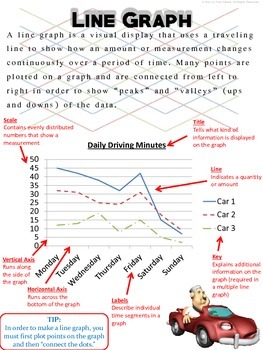
Line Graphs: How-To Printable
These printables help students read line graphs, data, and charts that display gathered numbers visually. It includes the following:
-An informative model line graph
-Data tables to be completed
-Analysis questions to answer after reading graphs
-Whole line graphs to be created on their own
This would be a huge help in science class to teach how to display gathered data via line graph. It could also be used in math class when covering graphs. Enjoy!
BUY THE WHOLE GRAPHING BUNDLE HERE! An $8
Grades:
5th - 9th
Heroes of the Environment Earth Day Novel Guide
Heroes of the Environment True Stories of People Who Are Helping To Protect the Planet by Harriet Rohmer Guide is perfect for teaching about current agricultural practices, compost, pesticides, fertilizers, vertical farming, e-waste, water pollution, mountain removal, depletion of wetlands, oil drilling and environmental cost and much more. Printable & Nearpod (integrates with Google Classroom)After this lesson students will:- be able to explain how to make compost- be able to verbalize the
Subjects:
Grades:
6th - 8th
CCSS:
Graphs - "Welcome to the Graph-time Show"
This bundle has a variety of printables that help students read graphs, data, and charts that display gathered numbers visually. There are four main sections in this package:
The following products are included in this bundle:
- LINE GRAPHS HOW-TO PRINTABLE
- BAR GRAPHS HOW-TO PRINTABLE
- PIE CHARTS HOW-TO PRINTABLE
- SCATTER PLOT GRAPHS HOW-TO PRINTABLE
Each section includes an informative model graph, data tables to complete, analysis questions to answer, and whole graphs to be created on th
Grades:
5th - 9th
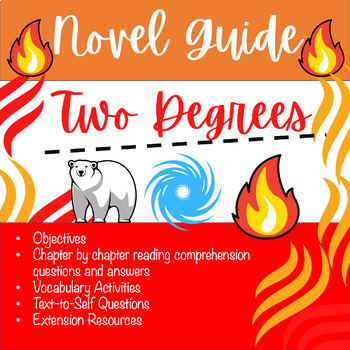
Two Degrees by Alan Gratz Environmental Science Middle School Novel Guide
Two Degrees by Alan Gratz Environmental Science Middle School Novel Guide is great for teaching about wildfires, hurricanes and environmental threats to Arctic animals and Earth's ecosystem. This novel guide consists of two parts, teacher's section and student's section. Filled with background information on wildfires, hurricanes, and the Arctic ecosystem. This novel guide includes:Learning ObjectivesKWL ChartChapter-by-chapter reading comprehension questions and answersBackground geographical i
Subjects:
Grades:
4th - 7th
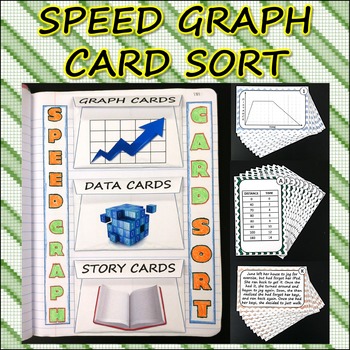
Science Journal: Speed Graph Card Sort
Save 20% and buy the BUNDLE!Card Sorts of Science BundleThis card sort is for practicing interpretion and understanding of distance/time graphs (speed graphs) in correlation to data tables and stories that represent those graphs. See the VIDEO PREVIEW: Speed Graph Card SortThe card sort comes with 30 cards... 10 cards are various distance/time graphs, 10 are data tables, and 10 are short stories. When students use this card sort, they are to study and interpret the various graph cards. They will
Subjects:
Grades:
6th - 9th
Also included in: Bundle: Super Speed Power Pack
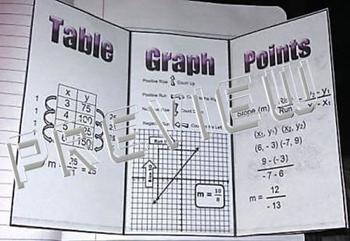
Calculate Slope Foldable Graphic Organizer Interactive Notebook
This is a 2 page PDF file that displays the 3 most common ways to calculate slope: the Slope Formula, a Table of Values and from a Graph.
The foldable is meant to be double-side printed to create a tri-fold brochure style document.
Download the free preview to see the details of the foldable.
FOLLOW ME ON TpT!
REMEMBER TO LEAVE FEEDBACK & A RATING TO EARN TpT CREDITS (details below)
TpT Credits
http://www.teacherspayteachers.com/Tptcredits
How it Works
Earn TpT Credits for purchases
Subjects:
Grades:
6th - 12th, Adult Education
STAAR Math Daily Warm Ups Grade 5 (Bundle)
Four full months of STAAR Math Warm Ups! STAAR Math PREP with sixteen weeks of daily warm-ups for 5th grade. Released STAAR Math Materials have been adapted into four months of STAAR prep. These warm ups are great for STAAR Math Prep or even beginning of the year 6th Grade math review!STAAR Math Warm Ups Includes:Focused on STAAR Readiness StandardsThree questions each dayFour weeks of spiraling STAAR warm upsSTAAR vocabulary and rigor132 Total Pages: a full-page set for projection and a half-pa
Subjects:
Grades:
4th - 6th
Types:

Kiss the Ground Documentary Soil Carbon and Climate Change NGSS Lesson
"Kiss the Ground" Documentary Soil Carbon and Climate Change Earth Day Environmental Science Lesson is perfect resource for teaching about agricultural practices, soil degradation, use of pesticides and fertilizers, desertification, and possible solutions. This resource includes:Learning ObjectivesKWL Chart Cause & Effect ChartThe connection between soil carbon and climate changeCurrent agricultural practices Soil background knowledgeCauses of Soil Degradation Problematic use of pesticides a
Subjects:
Grades:
6th - 9th
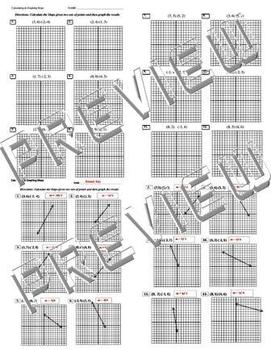
Calculate and Graph Slope Rise Over Run Worksheet Quiz Review Practice
This is a PDF worksheet that provides 12 problems for calculating slope given two sets of ordered pairs and graphing the rise over run.
The PDF file contains the answer key.
Your feedback/product rating is appreciated
FOLLOW ME ON TpT!
Subjects:
Grades:
6th - 12th, Adult Education
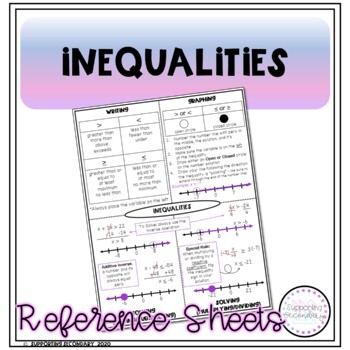
Inequalities One-Page Reference Sheet
This Inequalities One-Page Reference Sheet is perfect to use throughout a unit, at the beginning prior to the lesson, or at the end as a review sheet/study guide before an assessment. This reference sheet can also be used for those students whose IEP's include accommodations such as visual aids or rule cards.This one-page reference sheet includes:Writing InequalitiesGraphing InequalitiesSolving one-step with addition and subtractionSolving one-step with multiplication and divisionIncludes flippi
Grades:
6th - 8th
Types:
Also included in: Middle School Math Reference Sheet Bundle
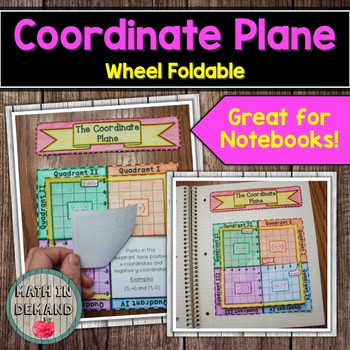
Coordinate Plane Wheel Foldable (The Coordinate System)
Students will be constructing a wheel foldable on the coordinate plane. This is a simple foldable that goes over the quadrants in the coordinate system. There are 3 versions: (1) Fill-in, (2) Blank, and (3) Answer Key.
Grades:
4th - 6th
Also included in: Math Foldables Bundle (Includes All Math Wheel Foldables)
Grade 6 Module 3 Math Review Packet
Update July 2022: An editable Google Docs version and a PDF version for easy printing.A 5 page review packet of all of the 6th Grade Engage NY Module 3 with an answer key. A variety of word problems cover the entire module to review for module exams/final exams. Topics include absolute value, positive and negative integers, ordering numbers, plotting points, and basic transformations. All modules are also condensed at a lower price! (See my page for all of the modules!)Please let me know if you
Subjects:
Grades:
6th
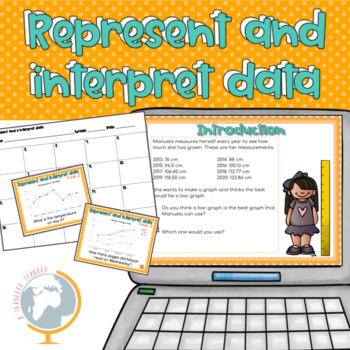
Bundle Represent and Interpret Data. Line Graphs.
In this bundle you can find excellent resources to work the topic represent and interpret data.You will find a digital study guide to work with your students:Types of dataTypes of graphWhat is a line graphHow to read a line graphHow to create a line graph2 games with the app quizizz to practice the types of data and the types of graphsYou will also find a set of 20 questions: 5 different line graphs with 4 question each for students to analyze the information provided and answer questions.You ca
Grades:
4th - 6th
Types:
CCSS:

StayGiant Earth Science Bundle: Astronomy (space exploration)
Teachers use the Strategic Instruction Model (SIM) Concept Enhancement Routines to transform abstract main ideas and key topics into a concrete representation that helps students think about and talk about the key topic and essential related information. SIM is about promoting effective teaching and learning of critical content in schools. SIM strives to help teachers make decisions about what is of greatest importance, what we can teach students to help them to learn, and how to teach them well
Subjects:
Grades:
6th - 12th
NGSS:
HS-ESS1-6
, HS-ESS1-4
, MS-ESS1-2
, MS-ESS1-3
, HS-ESS1-3
...
Showing 1-24 of 231 results


