7 results
3rd grade statistics scaffolded notes under $5
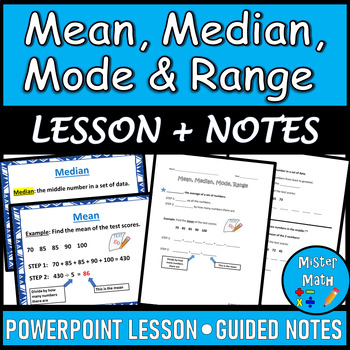
Mean, Median, Mode & Range PPT and Guided Notes BUNDLE
This Mean, Median, Mode & Range BUNDLE includes a PowerPoint Lesson and a corresponding Guided Notes Packet to assist students in learning about finding the mean, median, mode, and range of data sets. The PowerPoint and Guided Notes packet include key vocabulary, as well as an example for each skill. Additional practice problems are included that ask students to find the mean, median, mode and range of four data sets (for a total of 16 extra practice problems!) The presentation also comes fu
Subjects:
Grades:
3rd - 6th
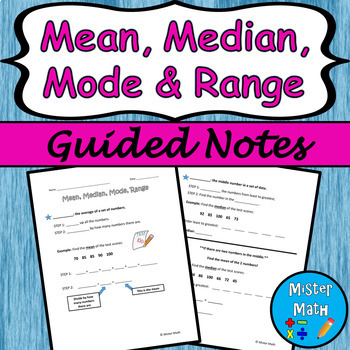
Mean, Median, Mode & Range Guided Notes
This is a guided notes resource to assist students in learning about finding the mean, median, mode, and range of data sets. The guided notes include definitions, as well as a guided example for each skill. An independent practice worksheet is included that asks students to find the mean, median, mode and range for four data sets (for a total of 16 extra practice problems!) An answer key is also provided.This Guided Notes packet is also part of a BUNDLE that includes a PowerPoint presentation to
Subjects:
Grades:
3rd - 6th
Also included in: Mean, Median, Mode & Range PPT and Guided Notes BUNDLE
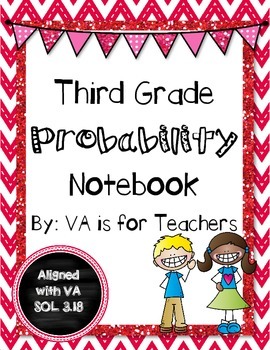
Third Grade Probability Notebook
This pack is aligned with the VA SOLs 3.18. These notes are set up to be used in an interactive notebook.
Topics include:
describing probability in words (likely, unlikely, certain, impossible)
describing probability as a fraction
finding combinations using tree diagrams
finding combinations using multiplication
There is also a worksheet reviewing the vocabulary.
Subjects:
Grades:
3rd - 4th
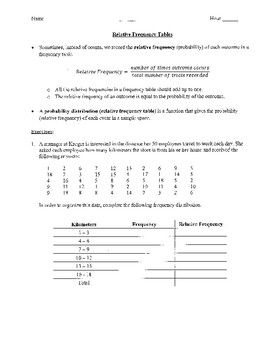
Relative Frequency Tables (Notes and Practice)
This resource can be used to introduce relative frequency tables (probability distributions). It begins with definitions and a formula for relative frequency (probability). It then provides 2 examples where students create relative frequency tables (probability distributions) based on sets of data. Students also create a bar chart to represent the data in the second example. A key is provided.
Subjects:
Grades:
3rd - 12th
Mean, Median, Mode, Range, & Box Plot Foldable
Mean, Median, Mode, Range, & Box Plot Foldable
No prep! Simply copy the foldable pages front and back. If you want it for your Interactive Math notebook, then I suggest shrinking it by 80%.
Answer key included!
Subjects:
Grades:
3rd - 9th
Wilkie Way Pocket Guide To Developing Statistical Thinking
A guide to the essentials for developing statistical thinking and understanding how data displays are constructed to ensure correct interpretation of displays.
The statistics for students in the middle primary years.
Download onto your phone or tablet and have a quick guide at your fingertips.
Subjects:
Grades:
1st - 4th
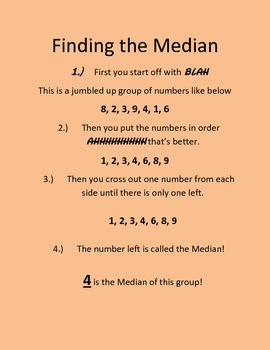
Finding the Median and the other landmarks! Common Core
This is a walk through that I use to help explain what the median is to the students. I have a saying that mixed numbers out of order are called BLAH in my classroom. There job is to put them in order so we feel better AHHHHHH. Then start crossing out numbers on each side until the middle number is left. The is also a second sheet that contains guided teaching notes to explain how to find the Min, Max, Range and Mode. Hope this helps you!
Tom "Lucky"
Subjects:
Grades:
3rd - 5th
Showing 1-7 of 7 results


