144 results
Graphing homework for Easel Activities
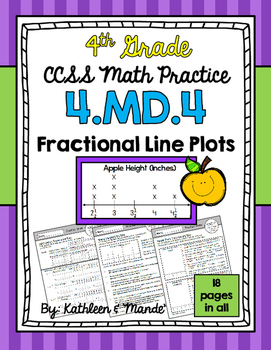
4.MD.4 Practice Sheets: Fractional Line Plots
This 4.MD.4 CCSS aligned packet includes 18 practice sheets to teach/reinforce line plots with whole numbers, fractions, and mixed numbers. These sheets can be used to introduce a concept, review a concept, or send home as reinforcement for homework. **An answer key is provided.- - - - - - - - - - - - - - - - - - - - - - - - - - - - - - - - - - - - - - - - - - - - - - - - - - - - - - - - - - - - - - - - - - -This resource can be used along with our other 4.MD.4 resources:4.MD.4 Task Cards: Set 1
Subjects:
Grades:
3rd - 5th
Types:
Also included in: 4.MD.4 BUNDLE: Fractional Line Plots
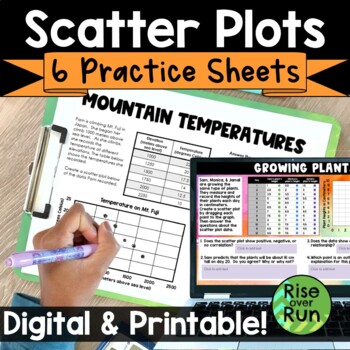
Scatter Plots & Line of Best Fit Practice Worksheets
Practice using scatterplots with these six activities. They can be used as bell ringers, exit tickets, homework, or just general practice. Students graph points, interpret data, and look for types of correlation with these practice sheets. All practice sheets are included as printable PDFs and interactive Google Slides. 6 scatter plot activities are included:Test Grades Scatter Plot PracticeMountain Temperatures Scatter Plot PracticeGrowing Plants Scatter Plot PracticeHair Length Data Collectio
Grades:
8th - 9th
Types:
CCSS:
Also included in: 8th Grade Math Activities & Lessons Bundle for the Whole Year
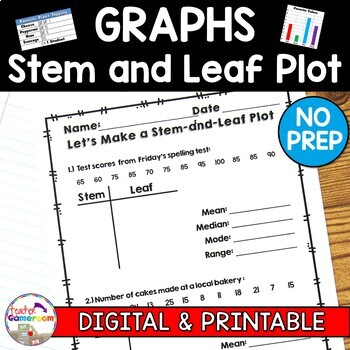
Making a Stem and Leaf Plot with Mean, Mode, Median, Range Worksheets
These worksheets allows students to make a stem and leaf plot using a given set of data. Student must build the plots on their own and then must find the mean, median, mode, and range of the data. There are 4 worksheets, each with 2 Stem and Leaf graphs to be made. Great for review or as a homework assignment. Full Page answer keys included. Extra licenses are $0.75.Questions/Materials include:✔️ 2 Questions per page✔️ 4 Worksheets✔️ 10 - 12 Numbers per graph✔️ 2-Digit and 3-Digit Numbers✔️ Rea
Grades:
4th - 8th
Types:
CCSS:
Also included in: Graphs Bundle | No Prep Digital Resources
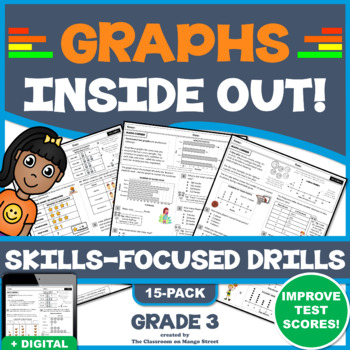
3RD GRADE GRAPHS: BAR, PICTURE, & LINE PLOTS - 15 Skills-Boosting Worksheets
Students will complete word problems related to bar graphs, pictographs, line/dot plots and tally charts. This includes reading and interpreting data, performing calculations, matching data to and representing data in graphs. Use these scaffolded math drills to teach and reinforce the fundamentals, or prep for test day. Each drill begins with a mini-lesson followed by several Common Core designed, simulated test questions (including multi-part & open response). These practice worksheets
Subjects:
Grades:
3rd - 4th
Types:
Interpreting Data and Graphing Math Worksheets Bar, Picture Graphs, Tally Charts
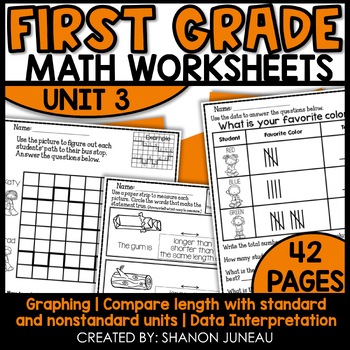
These Graphing & Measuring 1st Grade Math Worksheets will help you with graphing, measuring, and working with a simple grid to determine path. These first grade work sheets are perfect for guided instruction, independent instruction, skill reinforcement, and homework. BUNDLED FOR CONVENIENCEYear-long 1st Grade Math Worksheets Save 25%These worksheets cover:measurement (shorter, longer) (shortest, longest)measurement with centimeter cubesgraphing with numbers and tally markscounting pathsbl
Grades:
1st
Types:
Domain and Range of Functions Worksheet
Hey there, Math Teachers! Empower your students to master domain and range identification with our comprehensive worksheet! Our two-sided PDF worksheet includes 32 thought-provoking questions that cover identifying the domain and range of relationships given as ordered pairs, graphs, or tables.Using the vertical line test, students will learn to identify functions and define them as a relationship between x and y that assigns exactly one output for every input. Our easy-to-use answer key ensures
Grades:
8th - 9th
Types:
CCSS:
Also included in: Relations and Functions Introduction Worksheets Bundle
Slope Intercept Word Problems Matching Worksheet
Hey Math Chefs! Are you ready to add a dash of flavor to your slope-intercept equation lessons? Get ready to embark on a delicious math adventure with our mouthwatering worksheet, served up with an Italian pizza twist! Why Choose Our Pizza Parlor Math Worksheet? Real-World Pizza Problems: Say arrivederci to boring math problems! Our worksheet features 15 scrumptious real-world situations that students must match with the appropriate Slope-Intercept Equation. From slicing pizza pies to delivering
Subjects:
Grades:
8th
Types:
Also included in: Graphing Linear Equations Worksheets Bundle
Story Motion Graphs - Distance-Time Graph Writing Activity
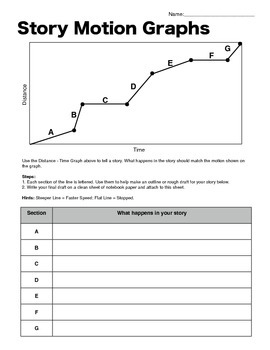
This writing activity will allow you to see how well students can interpret a distance-time graph, and let them use their imaginations as well.
Each section of the graph is labeled with a letter. In the table below, students can create an outline for their story that matches the motion graphed above. Then, they can write their final draft on a clean sheet. Even better: there is an advanced version for your higher-level thinkers. They must label the axis with units that match their story.
The
Grades:
5th - 8th
Types:
Finding and Comparing Rates of Change as Slope Worksheet
Hey Math Maestros! Ready to turn function comparison into a party of mathematical marvels? Look no further! Our dazzling two-sided worksheet is the key to helping your middle school Pre-Algebra or Algebra 1 students shine in comparing properties of linear functions. Why Jump Into Our Function Fiesta? Versatile Function Exploration: Dive into the world of linear functions! This worksheet is a passport to comparing slopes algebraically, numerically, and graphically. It's not just about learning; i
Grades:
8th
Types:
CCSS:
Also included in: Finding Slope Worksheets Bundle
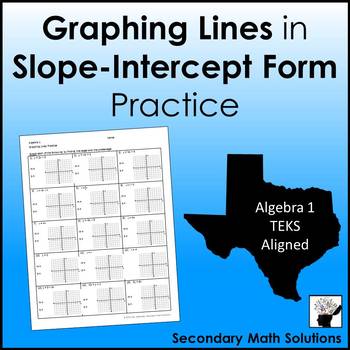
Graphing Lines in Slope-Intercept Form Practice
This is a one-sided practice page on graphing lines in slope-intercept form. There are 15 practice problems designed for the beginning grapher. Almost all of the equations are in y = mx + b format. The student first identifies m and b from the equation then uses them to graph. The two special cases are included and only a few equations need some "adjustment" such as 3y = 6x. Key included.Also available:Graphing Lines in Slope-Intercept Form NotesGraphing Lines Partner Activity Task Cards© 2015 S
Subjects:
Grades:
8th - 11th
Types:
Also included in: Linear Functions Unit Bundle - Algebra 1 Curriculum

Data Analysis and Graphing Worksheet Scientific Method Practice (Herons)
Students build GRAPHING and DATA ANALYSIS skills. This activity provides a data table and an incomplete bar graph related to nesting habits of herons. Students follow directions that lead them through foundational graphing and data analysis skills. Instruction is built into the worksheet. This activity builds the following skills:Setting up bar graphs, including choosing intervals, labeling axes, and writing graph titles.Using data to make a bar graph (with an example already in place).Pulling
Subjects:
Grades:
6th - 9th
CCSS:
NGSS:
MS-LS2-2
, MS-LS2-1
, HS-LS2-1
, HS-LS2-2
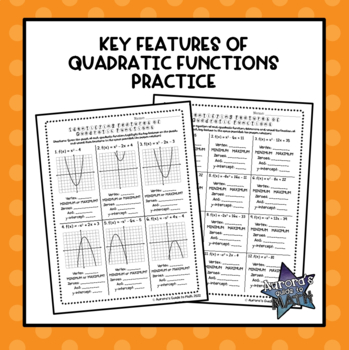
Key Features of Quadratic Functions
Key Features of Quadratic FunctionsThis no-prep resource is a great way to get students to practice identifying the key features of quadratic functions! This resource contains four pages of practice for a total of 28 practice problems! Each of the first three pages focus on a different representation of a quadratic (a page of graphs, a page of tables, and a page of equations). The fourth page contains multiple choice questions for test prep practice. This is a great way for students to practice
Subjects:
Grades:
6th - 12th
Types:

Graphing and Analyzing Data Activity with Scientific Method (Woodpeckers)
Use this data analysis and graphing worksheet to build GRAPHING and DATA ANALYSIS skills. This worksheet provides a data table from an experiment designed to find out which food woodpeckers prefer. Students follow directions that lead them through foundational graphing and data analysis skills, including making a bar graph and then analyzing it. Instruction is built into the worksheet. Students will practice the following skills in this activity:Setting up bar graphs, including choosing inter
Subjects:
Grades:
7th - 10th
CCSS:
NGSS:
MS-LS2-2
, MS-LS2-4
, HS-LS2-2
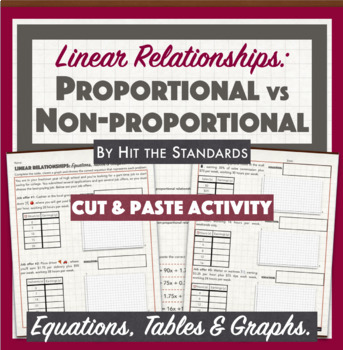
Proportional & Non-proportional Linear Relationships: Equations Tables Graphs
In this cut&paste activity, students must choose the best-paying job out of 5 given options. Each job salary represents a linear relationship, so students must complete a table, create a graph that represents each of them. Also, they must choose the correct equation (cut & paste) that represents each linear relationship. Finally, students must identify the relations as proportional or non-proportional. Hits CC Standards 7.RP.A.2, 8.EE.B.5, 8.F.B.4 & 8.F.B.5 Hits TEKS 8.4B, 8.5A, 8.5
Subjects:
Grades:
7th - 9th
Types:
Using Data to Tell How Many More or Less
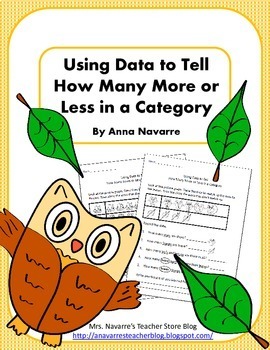
This Using Data to Tell How Many More or Less in a Category is a great beginning picture graph resource. Students compare numbers (pictures) by drawing lines in order to determine the difference between the two sets. Students then use the picture graph to answer questions about the graph and determine which category has more and which has fewer. Includes:This set includes 10 easy to use practice pages. Be sure to check out the preview to see more. Easel Activities - There are two versions of thi
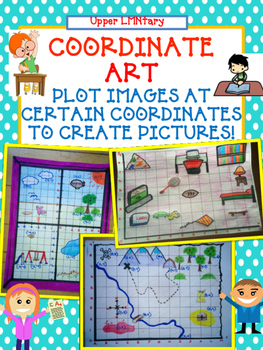
Coordinate Grid Number Line Art Activity - Distance Learning
Coordinate Grid Number Line Art Activity Students will design a scene by creating a coordinate grid/number line. Then students will draw pictures at specified coordinates to create a scene. Included:3 Student Assignment sheets (bedroom, treasure map, and window scenes)2 grid templatesCoordinate Art RubricTons of photos of samplesLet your students be creative and apply what they have learned about coordinates by creating CUTE Art! Use as a group project, home project, assessment or classwork.
Subjects:
Grades:
5th
Types:
Dilation Practice
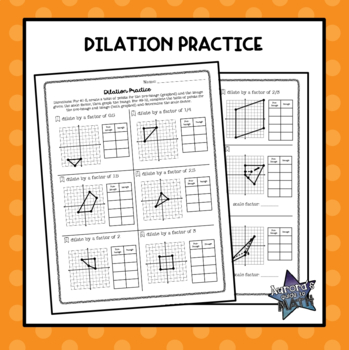
Dilation PracticeThis no-prep resource is a great way to get students to practice skills related to a geometric dilation! This resource contains a two-page practice activity containing 12 problems. For eight problems, students will perform a dilation given a graph of the original figure and a scale factor. For the last four problems, students are given a graph of the pre-image and image for a figure, and asked to determine the scale factor for the dilation that occurred. This is a great way for
Grades:
6th - 12th
Types:

Vertex Form (of a Quadratic) Notes & Practice
This is a double-sided notes page on Vertex Form of Quadratic Functions. TEKS Aligned: A6BThe notes begin with the vertex form equation and defining (h, k), (x, y) and "a". Next, four examples are provided where the student is given a quadratic function in vertex notation and has to identify the vertex and whether the parabola opens up or down. Then, they sketch a graph of the quadratic.Next, steps and a worked example are provided to show the student how to write the equation of a quadratic in
Subjects:
Grades:
8th - 12th
Also included in: Quadratic Functions Unit Bundle - Algebra 1 Curriculum

Scientific Method Worksheet Graphing and Analyzing Data Activity (Hummingbirds)
Build GRAPHING and DATA ANALYSIS skills! This worksheet provides a data table related to hummingbird migration. Students follow directions that lead them through graphing the data and analyzing it. Students will practice the following skills in this activity:Setting up bar graphs, including choosing intervals, labeling axes, and writing graph titles.Generating a bar graph from provided data.Pulling data from their graph.Data analysis that requires using data as evidence to support conclusions.R
Grades:
7th - 10th
CCSS:
NGSS:
MS-LS2-4
, MS-LS2-1
, HS-LS2-1
, HS-LS2-2

Graphing and Data Analysis Worksheet Scientific Method Practice (Juncos)
DATA ANALYSIS and GRAPHING ACTIVITY: Build science skills with real world data! This worksheet provides a data table and a line graph related to the months that one bird species visit bird feeders. Students follow directions that lead them through foundational graphing and data analysis skills. Students are not expected to make a graph from scratch, but are provided a scaffolded approach to practice these skills. Instruction is built into the worksheet. Students will practice the following
Subjects:
Grades:
6th - 9th
NGSS:
MS-LS2-2
, MS-LS2-4
Graphing Linear Equations in Slope Intercept Form ALGEBRA Worksheet
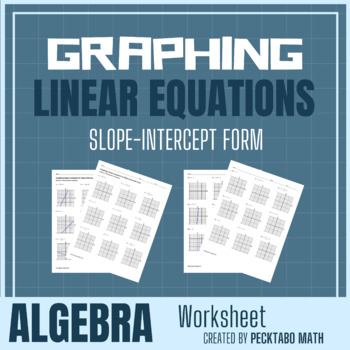
Graphing Linear Equations in Slope Intercept Form18 problems with a graph for students to use. Fits on two pages. Answer Key included in context.****************************************************************************Customer Tips: How to get TPT credit to use on future purchases: Please go to your My Purchases page (you may need to login). Beside each purchase you'll see a Provide Feedback button. Simply click it and you will be taken to a page where you can give a quick rating and leave a
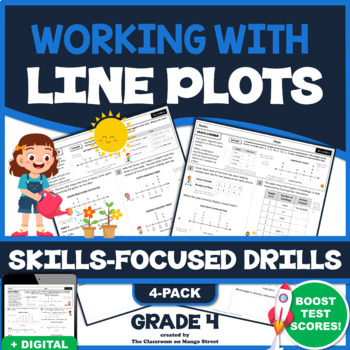
LINE PLOTS: 4 Skills-Boosting Math Worksheets | Grade 4 (4.MD.4)
NEW. Students will read and interpret data shown in line plots. They will also display and match data sets to line plots. Finally, students will solve word problems involving the addition and subtraction of fractions by using information presented in line plots. (4.MD.4). Use these guided math drills to teach and reinforce the fundamentals, or prep for test day. At the top of each worksheet is a mini-lesson followed by several Common Core designed, simulated test questions (including open
Subjects:
Grades:
4th - 5th
Types:
CCSS:
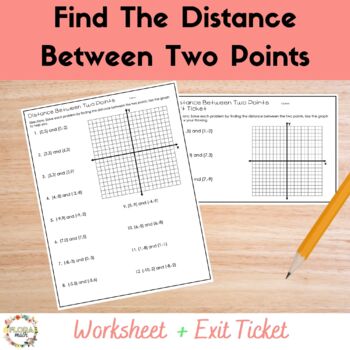
Distance on the Coordinate Plane Worksheet and Exit Ticket
Do your students need more practice finding the distance between 2 points on the coordinate plane? Try this worksheet and exit ticket pairing. Both activities are focused on distance between points with only vertical or horizontal change (no Pythagorean theorem required). Both the worksheet and the exit ticket have coordinate grids that students can use for problem solving or showing their thinking. The activities are ready to just print and use, and they are closely aligned.Hope you enjoy them!
Grades:
6th
Types:
CCSS:
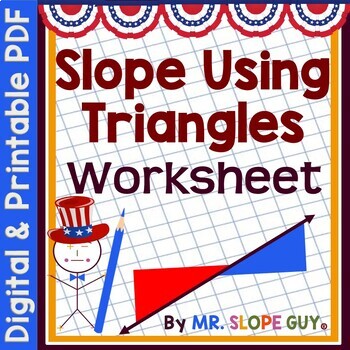
Finding Slope Using Right Triangles Worksheet
Calling All Math Explorers! Get ready to embark on an exciting journey through the world of slope with our Triangular Trek Worksheet! Students will grab their red and blue pencils to uncover triangles hiding in plain sight on graphs, unlocking the secrets to finding slope with ease! Discover the Adventure: Colorful Slope Exploration: Say goodbye to boring slope textbook assignments and hello to a vibrant world of math discovery! Our worksheet transforms the abstract concept of slope into an eng
Grades:
8th
Types:
CCSS:
Also included in: Finding Slope Worksheets Bundle
Showing 1-24 of 144 results


