Graphing Linear Equations Worksheets Bundle
Mr Slope Guy
1.6k Followers
Grade Levels
8th, Homeschool
Subjects
Resource Type
Standards
CCSS8.F.A.3
CCSS8.F.B.4
CCSS8.F.B.5
Formats Included
- Zip
- Easel Activity
Pages
Eight Worksheets
Mr Slope Guy
1.6k Followers
Easel Activities Included
Some resources in this bundle include ready-to-use interactive activities that students can complete on any device. Easel by TPT is free to use! Learn more.
What educators are saying
My students loved working through the problems on each worksheet. It gave them much-needed practice with a variety of problems. I appreciate the fact that I could use each no-prep worksheet consecutively in our unit. This is a great bundle that I will continue to use in the future.
This was a great resource to use with my 8th graders. This helped fill in the gaps they were missing.
Products in this Bundle (8)
showing 1-5 of 8 products
Description
Eight math worksheets targeting widely tested state math standards focusing on graphing concepts including intercepts, solutions, slope-intercept, and interpreting slope-intercept form. Each include a printable PDF, Four include corresponding Easel Activities.
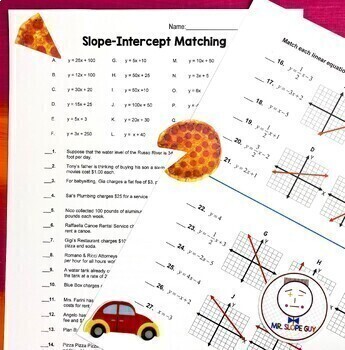
- Slope Intercept Word problems Matching Worksheet
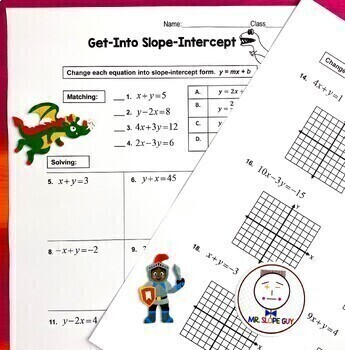
- Standard Form to Slope-Intercept Form Worksheet
- Graphing Lines in Slope-Intercept Form Worksheet
- Ordered Pair Solutions to Linear Equations Worksheet
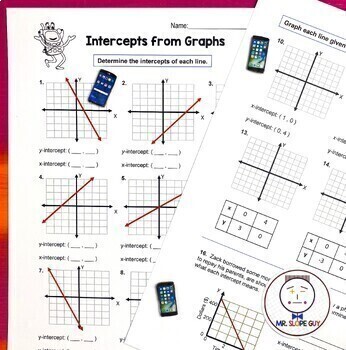
- Graphing Using Intercepts Worksheet
- Intercepts Graphing Linear Equations Worksheet
- Tables, Equations, and Graphs Worksheet
- Slope-Intercept Form Worksheet
Mr. Slope Guy
Teacher Feedback
"My students loved working through the problems on each worksheet. It gave them much-needed practice with a variety of problems. I appreciate the fact that I could use each no-prep worksheet consecutively in our unit. This is a great bundle that I will continue to use in the future."
"Lifesaver bundle, love the fact they have video as as well"
"These worksheets are fabulous. Very Comprehensive. "
Total Pages
Eight Worksheets
Answer Key
Included
Teaching Duration
N/A
Report this resource to TPT
Reported resources will be reviewed by our team. Report this resource to let us know if this resource violates TPT’s content guidelines.
Standards
to see state-specific standards (only available in the US).
CCSS8.F.A.3
Interpret the equation 𝘺 = 𝘮𝘹 + 𝘣 as defining a linear function, whose graph is a straight line; give examples of functions that are not linear. For example, the function 𝘈 = 𝑠² giving the area of a square as a function of its side length is not linear because its graph contains the points (1,1), (2,4) and (3,9), which are not on a straight line.
CCSS8.F.B.4
Construct a function to model a linear relationship between two quantities. Determine the rate of change and initial value of the function from a description of a relationship or from two (𝘹, 𝘺) values, including reading these from a table or from a graph. Interpret the rate of change and initial value of a linear function in terms of the situation it models, and in terms of its graph or a table of values.
CCSS8.F.B.5
Describe qualitatively the functional relationship between two quantities by analyzing a graph (e.g., where the function is increasing or decreasing, linear or nonlinear). Sketch a graph that exhibits the qualitative features of a function that has been described verbally.


