TPT
Total:
$0.00
Selected
Grades

Subjects

Arts & Music
English Language Arts
Foreign Language
Holidays/Seasonal
Math
Science
Social Studies - History
Specialty
For All Subject Areas
347 results

8th grade Summer statistics graphic organizers
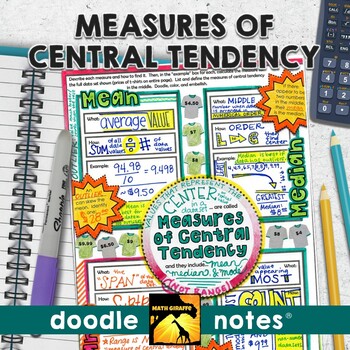
Preview of Measures of Central Tendency Doodle Notes (Mean, Median, Mode, & Range)
Measures of Central Tendency Doodle Notes (Mean, Median, Mode, & Range)

Created by
Math Giraffe
Mean, Median, Mode, and Range (Measures of Central Tendency): "doodle notes" - visual note taking pages with interactive tasks for building stronger retention of measures of center (mean, median, mode, and range) for your middle school statistics unit in Pre-AlgebraBoost your students' focus and memory! The blend of graphic and linguistic input in these guided visual notes helps students' brains to convert the information to long-term memory more easily.When students color or doodle in math clas
Preview of SAMPLES & POPULATIONS  Doodle Math - Interactive Notebooks (Guided Notes)
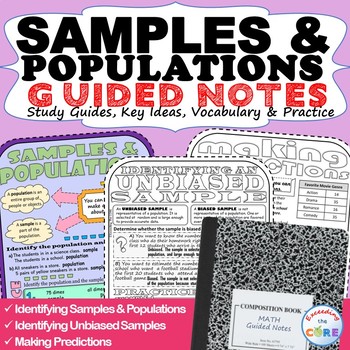
SAMPLES & POPULATIONS Doodle Math - Interactive Notebooks (Guided Notes)

- Great for online learning and distance learning!Have your students use these SAMPLES & POPULATIONS Guided Notes to review key ideas and essential vocabulary . Guided Notes aid in student focus, concept retention, engagement and creativity. Using this resource will allow students to synthesize this math concept and create their own tangible connections in their notes. Guided Notes Includes:__ Key Ideas with Verbal & Numerical Examples__ Essential Vocabulary with Definitions__ Skills Pr
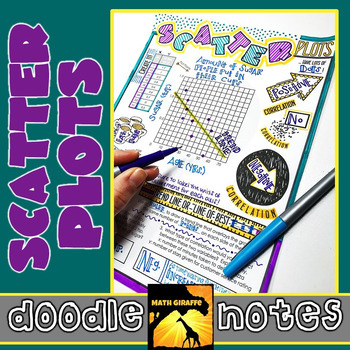
Preview of Scatter Plots Doodle Notes

Scatter Plots Doodle Notes

Created by
Math Giraffe
Creating & Analyzing Scatter Plots - Visual Interactive "Doodle Notes" When students color or doodle in math class, it activates both hemispheres of the brain at the same time. There are proven benefits of this cross-lateral brain activity: - new learning - relaxation (less math anxiety) - visual connections - better memory & retention of the content! Students fill in the sheets, answer the questions, and color, doodle or embellish. Then, they can use it as a study guide later on. C
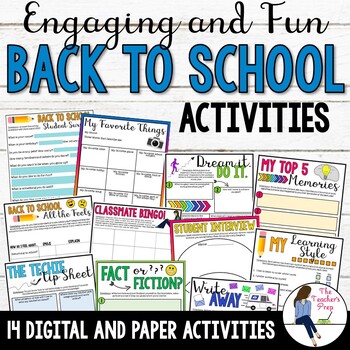
Preview of Back to School Activities for the First Week of School
Back to School Activities for the First Week of School

Ready to engage students with fun and memorable get to know you activities? These back to school activities will engage your students during the first weeks of school! Whether you use digital activities or prefer printed paper copies - this resource includes both versions so you can decide what's best for your students!This resource includes 14 activity pages available in Google Slides and in paper formats. You can also download a PowerPoint file of the pages within the Google Slides program. Wh
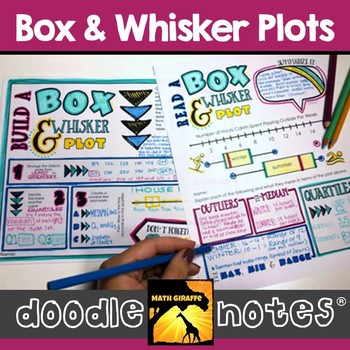
Preview of Box & Whisker Plots - Quartiles, Data, Outliers, etc. | Box Plots Doodle Notes
Box & Whisker Plots - Quartiles, Data, Outliers, etc. | Box Plots Doodle Notes

Created by
Math Giraffe
reading and creating box & whisker plots: visual interactive "doodle note" setWhen students color or doodle in math class, it activates both hemispheres of the brain at the same time. There are proven benefits of this cross-lateral brain activity:- new learning- relaxation (less math anxiety)- visual connections- better memory & retention of the content!Students fill in the sheets, answer the questions, and color, doodle or embellish. Then, they can use it as a study guide later on. G
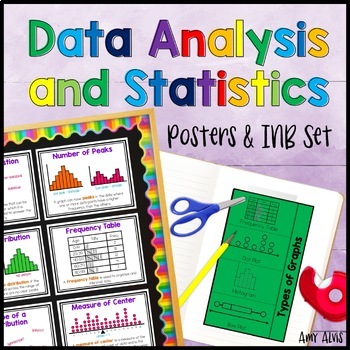
Preview of Data Analysis and Statistics Posters and Interactive Notebook INB Set
Data Analysis and Statistics Posters and Interactive Notebook INB Set

Created by
Amy Alvis
This poster (anchor chart) and interactive notebook (INB) set covers statistical questions, numerical data, categorical data, frequency table, dot plot, histogram, box and whisker plot, box plot, parts of a box and whisker plot, parts or a box plot, measure of center, spread, shape of distribution, symmetry, number of peaks, skewness, uniform distribution, outlier and gaps. The INB pages cover Types of Graphs, Statistical Questions and Patterns in Data.It includes 3 different interactive foldabl
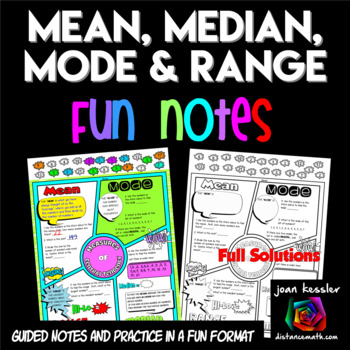
Preview of Measures of Central Tendency FUN Notes Doodle Pages
Measures of Central Tendency FUN Notes Doodle Pages

Created by
Joan Kessler
Your students will love learning the Measures of Central Tendency with these Fun Notes done in a comic book theme. Topics include Mean, Median, Mode, and Range. Students complete 6 problems plus definitions. There are two versions of the notes so you can differentiate. The PDF also includes 2 sizes, one standard 81/2 x 11" and the other in half size for INB's. Students love to doodle while learning and it has been shown that doodling and working with fun themed activities help students engage
Preview of Summer School Middle School ELA Curriculum Bundle - Writing, Grammar, Vocab
Summer School Middle School ELA Curriculum Bundle - Writing, Grammar, Vocab

Teaching summer school ELA has never been easier! This complete Summer School Curriculum Writing Mega Bundle has 29 lessons and includes everything you need to teach ELA and grammar in summer school. All lessons include a fun and engaging slide show presentation. Numerous lessons include an instructional video. Each lesson has a detailed lesson plan that provides rigor with differentiation and enrichment suggestions. The worksheets are designed to encourage guided note-taking skills and are i
Preview of Mean, Median, Mode, and Range Wheel Foldable (Center of Distributions)
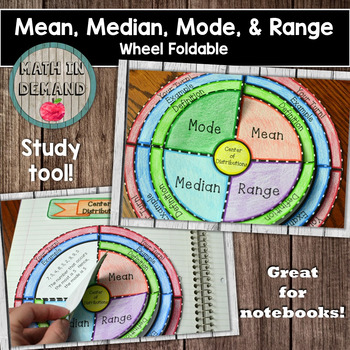
Mean, Median, Mode, and Range Wheel Foldable (Center of Distributions)

Created by
Math in Demand
Students will construct a foldable on mean, median, mode, and range. There are 4 layers for the foldable: (1) Title, (2) Definition, (3) Example, and (4) Your Turn!. There is also a blank template included. CLICK HERE to see my math foldables bundle! CLICK HERE TO CHECK OUT MY VIDEO ON THIS FOLDABLE!
Preview of Standard Deviation Foldable

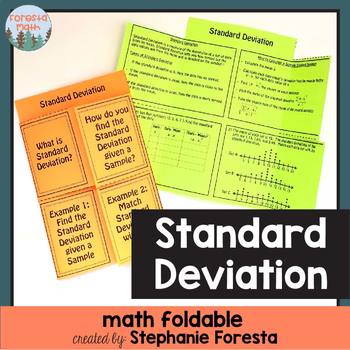
Standard Deviation Foldable

Created by
Foresta Math
A fun foldable to teach or review finding the standard deviation of a sample. The foldable defines standard deviations, lists the steps to find standard deviation, and has two examples. The first example is a small sample that you can teach students how to find the standard deviation by hand. The second example has 3 standard deviations that must be matched with 3 dot plots by understanding the meaning of small and large standard deviations.
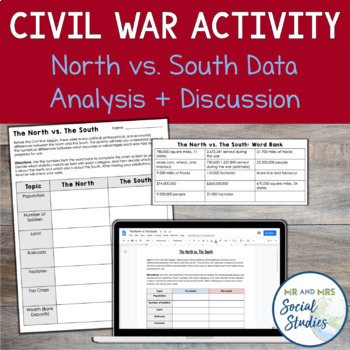
Preview of Civil War Activity | North vs South Statistics Activity and Worksheet
Civil War Activity | North vs South Statistics Activity and Worksheet

This no-prep American Civil War activity will help your students understand the differences between the North and the South...using data! If you need an activity to kick-off your Civil War unit or want a resource that highlights the differences between the North and the South, this is the resource for you! In this engaging activity, students receive a blank chart with many categories of data about the Civil War. Some of these categories include the population, the number of factories, and total
Preview of Residual & Residual Plots Foldable

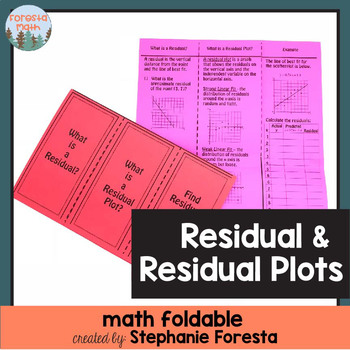
Residual & Residual Plots Foldable

Created by
Foresta Math
A fun foldable to review or teach residuals and residual plots.
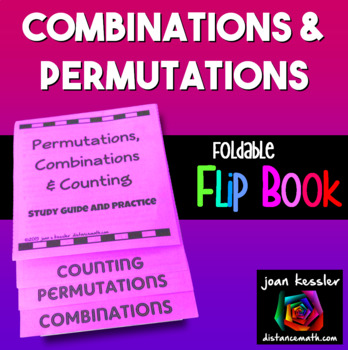
Preview of Permutations and Combinations Foldable  Flip Book
Permutations and Combinations Foldable Flip Book

Created by
Joan Kessler
This Flip Book includes guided notes and practice on Combinations, Permutations, and the Counting Principles.There are 19 problems for students to complete including a challenge problem on the back which is great for differentiation and early finishers. This makes a great study guide.The Flip Book is a perfect size for traditional or Interactive Notebooks, or just to use for studying for a test. Final size 4¼″ x 6½″. This is easy to make, no glue, no mess. Print one page double-sided, make one
Preview of Correlation Coefficient (Cheat Sheet & Notes)
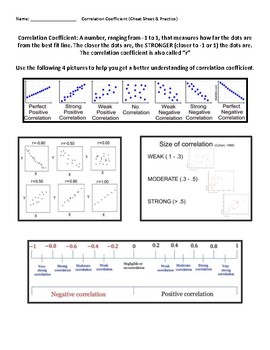
Correlation Coefficient (Cheat Sheet & Notes)

Created by
SkewLines
This resource can be used as a self-directed worksheets where students use the cheat sheet to access the 8 practice problems. I typically use this as an extention for 8th graders during the scatter plots unit, or for 9th graders. An answer key is provided. Enjoy!
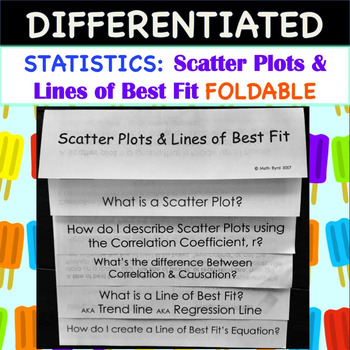
Preview of Statistics:Scatter Plots and Lines of Best Fit FOLDABLE
Statistics:Scatter Plots and Lines of Best Fit FOLDABLE

Created by
Math Byrd
So Easy to Use! Simply print and fold! No need to rotate pages! Scatter Plots and Lines of Best Fit FOLDABLE also includes a PowerPoint to go along with the foldable.Foldable has 2 tiers of differentiation, perfect for the inclusive classroom! 1 set has fill-in-the-blank style notes within the foldable, while the other foldable has the notes already filled in. On both sets, students will have to work out the examples.Students will learn how to: Create Scatter PlotsDescribe Scatter Plots using Co
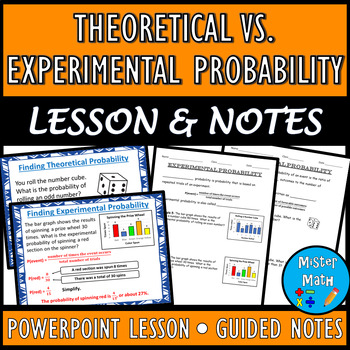
Preview of Theoretical vs. Experimental Probability PPT & Guided Notes BUNDLE
Theoretical vs. Experimental Probability PPT & Guided Notes BUNDLE

Created by
Mister Math
This BUNDLE includes a PowerPoint Lesson and a corresponding Guided Notes Packet to assist students in learning about theoretical and experimental probability. Students will learn the concepts of theoretical and experimental probability, as well as how to find the probabilities of each. Plenty of real-life examples are included to give students ample opportunities to practice the skills. Overall, the 21-slide PowerPoint and 6-page guided notes packet covers the following topics:Theoretical Proba
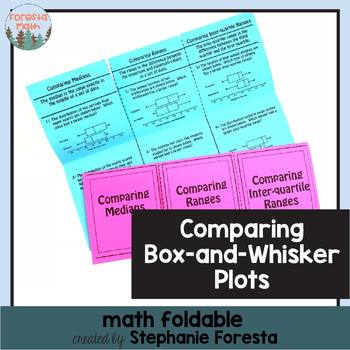
Preview of Comparing Box-and-Whisker Plots Math Foldables
Comparing Box-and-Whisker Plots Math Foldables

Created by
Foresta Math
A fun foldable to teach or review comparing medians, ranges, and inter-quartile ranges of two box-and-whisker plots.
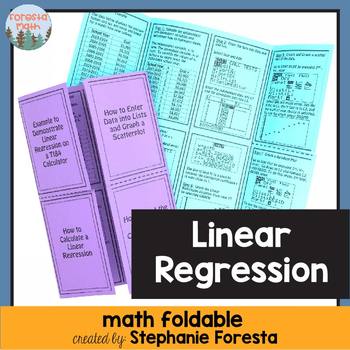
Preview of Linear Regression Foldable

Linear Regression Foldable

Created by
Foresta Math
A fun foldable to teach how to find the line of best fit, graph the line of best fit, find the correlation coefficient, graph a residual plot, and determine the goodness of fit. The foldable was created using TI84's new operating system so if you haven't updated your calculators the instructions will not follow along exactly. The foldable is completely filled in with instructions and images! It is a step by step tutorial for finding a linear regression on a graphing calculator.
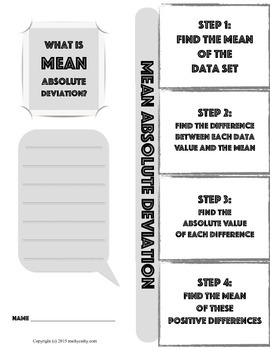
Preview of Mean Absolute Deviation Foldable Note-Taking Guide
Mean Absolute Deviation Foldable Note-Taking Guide

Created by
MathyCathy
This foldable will help make the process of learning how to calculate the mean absolute deviation of a data set easier to digest! In the new Texas TEKs, 8th grade students must be able to calculate the MAD of a small data set. This foldable note-taking guide helps students take this process one step at a time. I encourage students to reference this structured example as they work more complex problems, and analyze the MAD of multiple data sets. This foldable guide is designed to get them s
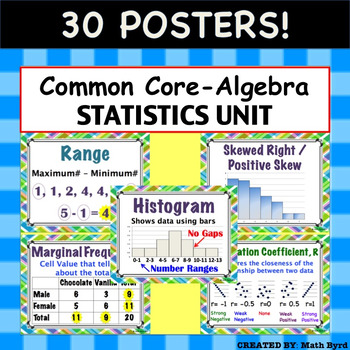
Preview of Common Core Algebra - Statistics Unit: Describing Data POSTERS
Common Core Algebra - Statistics Unit: Describing Data POSTERS

Created by
Math Byrd
30 Posters! Each 8.5" x 11" in size. Posters are aligned with Common Core's Algebra - Statistics: Describing Data Unit. Posters Included:MeanMedianModeRangeInterquartile RangeOutlierMean Absolute DeviationMeasures of CenterMeasures of SpreadDot PlotHistogramBox PlotNormal/ Bell Shaped DistributionSkewed Right/Positive SkewSkewed Left/ Negative SkewUniform2 Way Frequency TableJoint FrequencyMarginal Frequency2 Way Relative Frequency TableConditional Relative FrequencyScatter PlotCorrelationCorrel
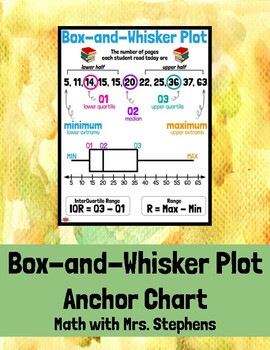
Preview of Box-and-Whisker Plot Anchor Chart

Box-and-Whisker Plot Anchor Chart

This anchor chart displays a data set with its corresponding box-and-whisker plot. It includes vocabulary of the "5 Number Summary", such as minimum, lower quartile, median, upper quartile, and maximum. The range and IQR are also represented. This can be printed one per page for individual student binders/notebooks or enlarged to be printed as a poster or anchor chart.
Preview of Skewed and Symmetric Distributions Math Foldable
Skewed and Symmetric Distributions Math Foldable

Created by
Foresta Math
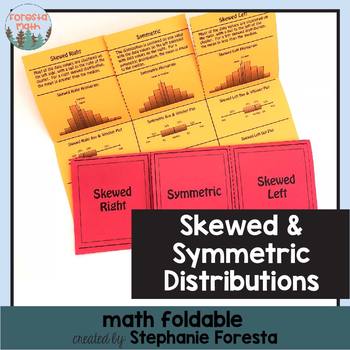
A fun foldable with skewed and symmetric distributions (histograms, box & whisker plots, and line plots).
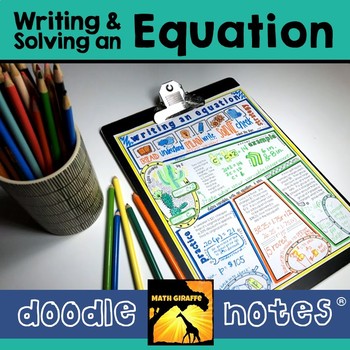
Preview of Writing an Equation Doodle Note | Problem Solving Strategy | Defining Variables
Writing an Equation Doodle Note | Problem Solving Strategy | Defining Variables

Created by
Math Giraffe
Steps for solving a problem by writing an equation - visual interactive "doodle notes" Students are guided through graphic notes for math problem solving through "Read, Understand, Plan, Write, Solve, and Check."When students color or doodle in math class, it activates both hemispheres of the brain at the same time. There are proven benefits of this cross-lateral brain activity:- new learning- relaxation (less math anxiety)- visual connections- better memory & retention of the content!Stude
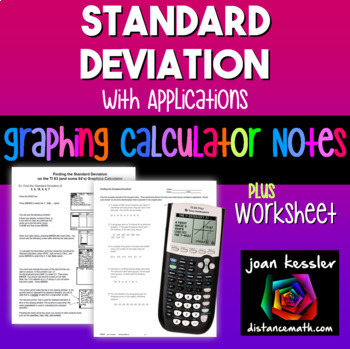
Preview of Standard Deviation on TI-84 Reference Sheets plus Practice

Standard Deviation on TI-84 Reference Sheets plus Practice

Created by
Joan Kessler
With this Determining the Standard Deviation on the TI 83 TI 84 Graphing Calculator plus HW step by step reference sheet your students will learn to use the graphing calculator effectively in finding the standard deviation from a data set. Use as Binder Notes or printed smaller for Interactive Notebooks.What's included?Two reference/handouts for students to learn how to find the Standard Deviation for both a population and for sample. One is for the TI 83 (yes, still in use) and the other for th
Showing 1-24 of 347 results

Discover Summer Teaching Resources | TPT

Uncover more about Summer teaching resources

Teach with Summer Printables from TPT

Summer break is finally here, and while students are excited to kick back and relax, teachers may be searching for fun summer activities to keep their students engaged and learning throughout the summer months in June, July, and August. Luckily, there are plenty of fun and educational resources available that can help keep students motivated and inspired, even when the weather is hot and the sun is shining. In this article, we will explore some of the best summer resources and printables for teachers and students, covering a range of subjects and activities to suit all ages and interests. So, whether you're a teacher looking for new ideas, or a student looking for a fun way to keep learning, read on to discover the best summer resources and printables available.

Ideas for Summer Fun & Learning

  1. Summer Reading Lists and Worksheets

One of the best ways to keep students engaged and learning throughout the summer is to encourage them to read. Reading helps to build vocabulary, comprehension, and critical thinking skills, and can be a fun and relaxing way to spend a lazy summer day. To help promote summer reading, TPT offers a variety of summer reading lists and worksheets for students of all ages. These lists typically include a variety of books in different genres and reading levels, along with discussion questions and activities to help students engage with the material.

  1. STEM Activities and Experiments

For students who love science and technology, there are plenty of STEM activities and experiments available that can be done at home or in the classroom. These activities can help students build skills in areas such as coding, robotics, and engineering, while also encouraging creativity and problem-solving. Some popular STEM activities for summer include building and launching rockets, creating homemade ice cream, and designing and building a solar-powered car.

  1. Art Projects and Crafts

Summer is a great time to get creative, and there are plenty of art projects and crafts that students can do to express themselves and build their skills. From painting and drawing to sewing and pottery, there are endless possibilities for creative expression. Some popular summer art projects include creating a nature journal, making a homemade birdhouse, and designing and creating a summer-themed t-shirt.

  1. Virtual Field Trips

While traditional field trips may not be possible during the summer months, virtual field trips offer a fun and educational alternative. Many museums, zoos, and other attractions offer virtual tours and exhibits that allow students to explore and learn about different topics from the comfort of their own homes. Some popular virtual field trips for summer include exploring the Great Barrier Reef, visiting the Louvre Museum in Paris, and taking a tour of the NASA Space Center.

  1. Summer Worksheets and Printables

For students who prefer more structured learning activities, there are plenty of summer worksheets and printables available that cover a range of subjects and topics. These worksheets can help students build skills in areas such as math, science, and language arts, while also providing a fun and engaging way to learn. Some popular summer worksheets and printables include word searches, crossword puzzles, and coloring pages.

  1. Coloring Pages

Other popular resources to explore are summer coloring pages. Easy to print and sure to keep your kids busy, coloring pages are an excellent way for children to express their creativity, unwind, and improve their fine motor skills. Teachers Pay Teachers offers an extensive selection of summer coloring pages featuring beach scenes, road trips, family outings, and more. These printables are suitable for children of all ages and can be a great addition to your summer routine. Your kids will enjoy spending hours coloring these delightful pages and creating their own masterpieces.

Get Started with Summer Resources from TPT

Summer break is a great time for students to relax and recharge, but it's also important to keep their minds active and engaged. With these top summer resources and printables for teachers and students, you can help keep your students motivated and inspired throughout the summer months. Whether you're promoting summer reading, offering STEM activities and experiments, or providing fun and creative art projects and crafts, there are plenty of ways to keep your students learning and growing all summer long. So, try out some of these fun and educational resources and see how they can make this summer your best one yet!

Frequently asked questions:

Are there free summer activities on TPT?

TPT offers many free summer printables as well as resources available for purchase. This includes individual resources as well as resource bundles. Be sure to explore your options and choose resources that fit your budget and needs.

What is an example of a summer printable on TPT?

There are many different types of summer time activities on TPT that are appropriate for little ones as well as for older kids. This includes resources like: Summer Escape Rooms, book report templates, summer reading logs, summer bingo, math-review packets, and many more. Perfect for sunny or rainy days, these activities will keep your students busy in their free time when they aren't playing with friends in the local pool.

How can I make sure my students stay engaged and motivated during the summer months?

Keeping students engaged and motivated when they are not in school can be a challenge, but there are a few things you can do to help. Encouraging summer reading, offering a variety of fun activities and projects, and providing positive feedback and encouragement can all help to keep students motivated and interested in learning throughout the summer.