26 results
11th grade algebra laboratories for Microsoft Word
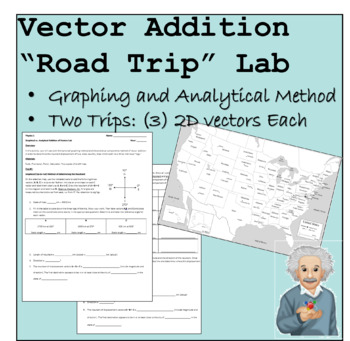
Vector Addition "Road Trip" Lab Activity
Overview:In this activity, students will use both the tip-to-tail graphing method and the analytical components method of vector addition in order to determine the resultant displacement of two, cross-country, trips which each have three individual "legs."Materials:Ruler, Protractor, Pencil, Calculator, Handout
Subjects:
Grades:
10th - 12th
Types:
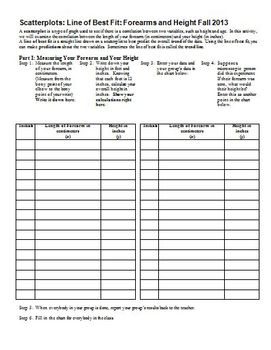
Scatterplots Linear Regression Line of Best Fit Forearms & Height (Editable)
After teaching my students about scatterplots, correlation, and the line of best fit, I take a day for them to do a hands-on lab, in which they measure their height (in inches) and their forearm length (from the tip of their elbow, to the bony point on their wrist), and we plot the class data, write the equation of the line of best fit, and then use the equation generated both forwards and backwards. They will need 45 minutes to an hour to do this in class.
I have found that if the students br
Subjects:
Grades:
7th - 12th
Types:
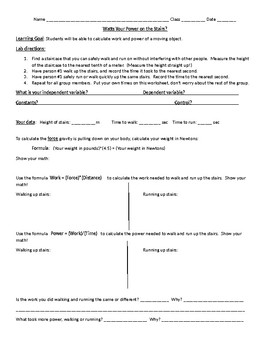
"Watts Your Power on the Stairs?" Quick lab calculating work and power
This lab activity has students compare the work and power they have while walking and running up a flight of stairs. This is a pretty common lab activity, but I just could not find a student handout that had exactly what I was looking for. So, I made this one and hope you will try it out and let me know how it goes!
Students will have to measure the distance and time of each trial, and use the work and power formulas. They will also identify the independent variable, dependent variable, cons
Subjects:
Grades:
6th - 12th
Types:
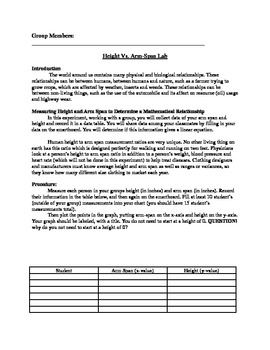
Height Vs. Arm Span Lab: Using real life data and linear regression
Students use their arm-span and heights to create a scatter plot and linear regression to find the equation for a line.
Subjects:
Grades:
8th - 12th
Types:
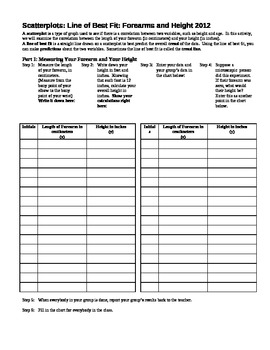
Scatterplots: Linear Regression Line of Best Fit:Forearms and Height (Editable)
After teaching my students about scatterplots, correlation, and the line of best fit, I take a day for them to do a hands-on lab, in which they measure their height (in inches) and their forearm length (from the tip of their elbow, to the bony point on their wrist), and we plot the class data, write the equation of the line of best fit, and then use the equation generated both forwards and backwards. They will need 45 minutes to an hour to do this in class.
Some years, the data have very littl
Subjects:
Grades:
7th - 12th
Types:
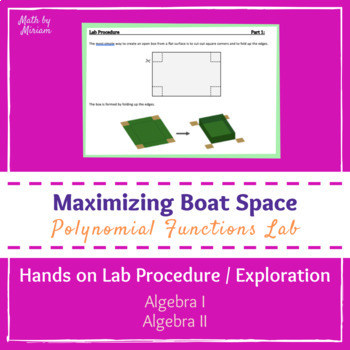
Introduction to Polynomials Functions Lab (PBL PrBL Activity)
This lab is meant to launch your Polynomials unit in an Algebra 2 class or an Honors Algebra 1 class. This is a perfect addition to any PrBL/PBL run class. Before teaching students anything, let them explore an application for a polynomial (cubic) function and derive a function themselves. The pre-lab directs students to build an open-face-box out of a single piece of paper with the largest volume possible in any way they choose (do not give them any further directions!). At the end of the pre-l
Subjects:
Grades:
9th - 11th
Types:
CCSS:
Also included in: Polynomial Functions Resource Bundle (PrBL PBL Unit)
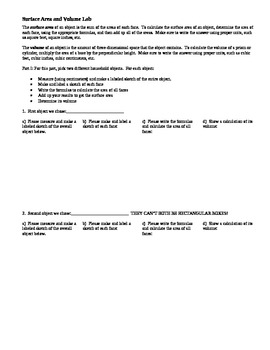
Surface Area and Volume lab (Editable)
I've taught my students the formulas for the surface areas and volumes of prisms, cylinders, and cones for a long time, and yet when they are asked to apply these formulas to everyday objects (cereal boxes, soup cans, printer cartridge packages, etc.), they seem to see the formulas as alien pieces of information.
I created this hands-on lab to help them with these concepts in a physical, hands-on way. This is a challenging activity for my students, sometimes because I find a few students who d
Grades:
9th - 11th
Types:
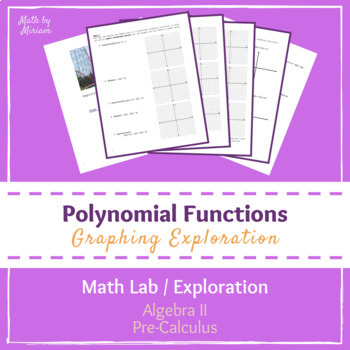
Polynomial Functions Exploration (PrBL PBL Activity)
This lab is designed to 1) introduce the relationship between a function rule, written in intercept form, and the zeros on a graph for all polynomial functions & introduce the concept of end behavior 2) allow students an opportunity to review multiplying polynomials and plotting coordinates precisely by hand. My students were lacking a strong Algebra 2 foundation so I designed this lab for them to raise them up to Pre-Calculus concepts (polynomial behaviors based on the way the function rule
Subjects:
Grades:
9th - 12th
Types:
CCSS:
Also included in: Polynomial Functions Resource Bundle (PrBL PBL Unit)
Volume Comparison matching activity
Students will try to match given subjects with their appropriate volume. At first, the students will have to match the cards using the volumes given, which will be in various forms (for example, one will be in cubic feet, one in pints, etc.). After recording their first choice, they will be given a conversion chart. Students should realize that comparing quantities, it is easier once you convert everything to the same unit of measure. After making the conversions, they will try to match the subj
Subjects:
Grades:
8th - 12th, Higher Education
Types:
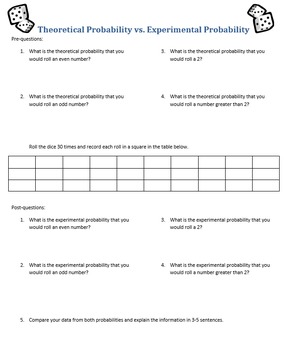
Theoretical vs. Experimental Probability
This is a dice activity that helps the students see the difference in theoretical and experimental probability.
Subjects:
Grades:
6th - 12th
Types:
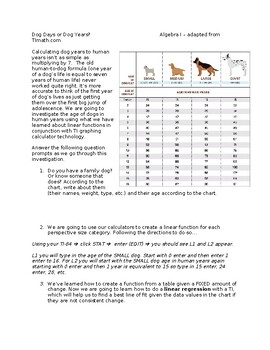
LINEAR REGRESSION - Dog Years vs. Human Years - Calculator Skill & Application
Who doesn't love dogs?!!! In this activity, students will investigate whether the rule of 7 human years = 1 dog year. Students will learn how to do a linear regression using a TI calculator to create the function. I did this lesson AFTER we did linear functions from a table. So when they felt comfortable doing this by hand, I was ready to show them this. We use the LINEAR REGRESSION tool when the change is not the same each time. Students loved this activity and were able to relate to it because
Grades:
5th - 12th
Types:
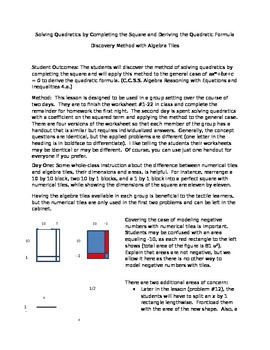
Discover Completing the Square to Solve Quadratics
Build the foundation for deriving the quadratic formula with this two to three day lesson. Then derive the formula. Group activity with four slightly different worksheets, so individual work must also occur.
Grades:
9th - 11th
Types:
CCSS:
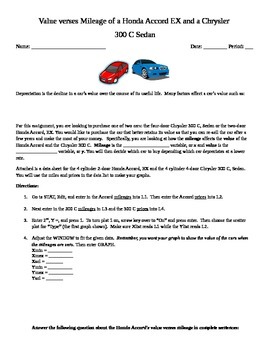
Value verses Mileage of a Honda Accord EX and a Chrysler Systems Problem
In this lesson activity, students explore the value verses mileage of two different cars. The students use linear regression find a line of best fit for the value vs. mileage of each car. The two lines form a system of linear equations. Using their data and equations, students can determine when the values of the cars will be the same and decide which car depreciates at a slower rate.
Subjects:
Grades:
9th - 11th
Types:
CCSS:

Studying the Sliding Filament Theory
This activity is great for graphing skills and determining correlations in data. It contains 2 sets of data to graph and compare dealing with muscle size and muscle strength. Great activity for decision making classes for mathematics and science. An excellent lab tool for physiology or biology classes as well.
Grades:
9th - 12th
Types:
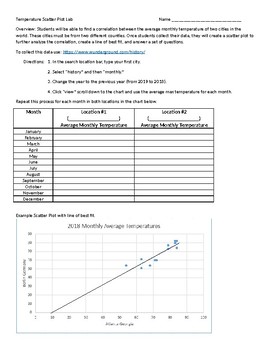
Temperature Correlation Lab
Students will be able to find a correlation between the average monthly temperature of two cities in the world. Once students collect their data, they will create a scatter plot to further analyze the correlation, create a line of best fit, and answer a set of questions. I usually allow for two class periods so the kids aren't rushed. It takes my kids around an hour and a half to complete the lab. This is a Word Document so you can edit as you please!!
Subjects:
Grades:
8th - 12th
Types:
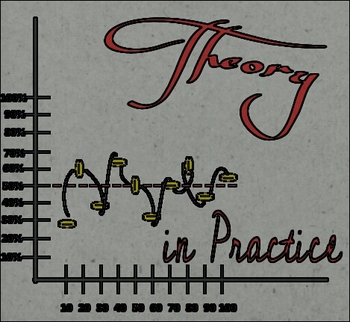
Theory in Practice
This activity requires students to flip a coin 100 times and calculate the cumulative probability for each trial of ten. Students should begin to develop the concept of theoretical versus experimental probability as the cumulative number of flips increases. Recognizing independent events, graphing scatter plots, and calculating percentages are skills students will practice during this activity. Teachers may use this activity as an introductory lesson for a unit on probability, in a statistics
Subjects:
Grades:
7th - 12th
Types:

Patterns in Polygons
This activity requires students to create diagonals in various polygons to determine the sum of the measures of the angles in those polygons and the total number of diagonals that can be constructed in each polygon. In addition to pattern recognition and developing formulas, students graph the data they collect to demonstrate linear and non-linear functions. Teachers can use this activity in an Algebra or Geometry course.
Grades:
7th - 12th
Types:
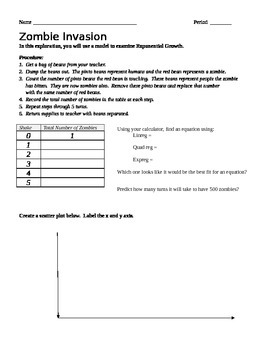
Zombie Invasion--Exponential Growth
students use 2 diff colored beans to replicate zombie invasion. Zombie beans touch another bean and make them zombies. They graph and find equation to fit. Paper folding on same lab.
Subjects:
Grades:
9th - 12th
Types:
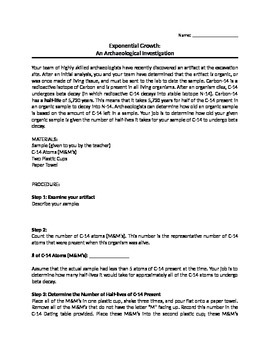
Exponential Decay & Radiocarbon Dating
Interdisciplinary approach that introduces exponential growth with a real-world application, radiocarbon dating, used by archaeologists. Students wills date an organic artifact (i.e. a stuffed animal/toy/bone/etc.) using a sample of M&M's (C-14 atoms) to demonstrate beta decay (in which the M&M's become atoms of N-14).
Subjects:
Grades:
7th - 12th
Types:
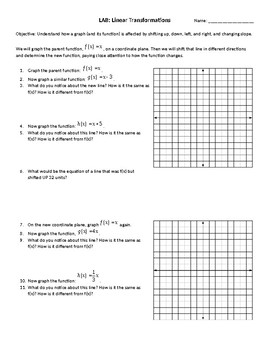
LAB: Linear Transformations
Students explore how a linear function changes (both graphically and algebraically) through observation. I highly recommend working through the first example as a class - or a similar example. But the best discussions happen when students work in groups and collaborate their hypotheses and conclusions.Feel free to make edits to adapt it to your needs! And as always, I would appreciate any feedback or ways to improve the lesson. Thank you!
Grades:
6th - 12th
Types:
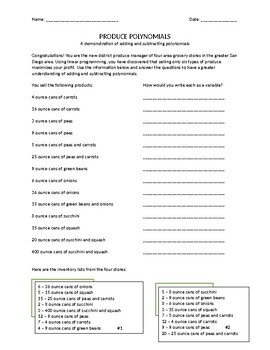
Produce Polynomials
Use a real life application of tracking the inventory of grocery stores to learn the concept of adding and subtracting polynomials. Includes a worksheet and answer key.
Subjects:
Grades:
8th - 12th
Types:
CCSS:
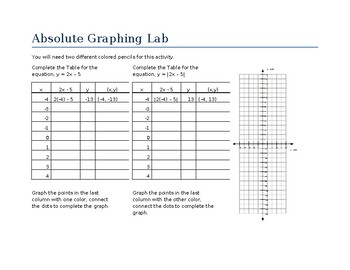
Absolute Value Graphing Lab
In this quick introductory lab, students will develop an understanding about the shape and properties of absolute value graphs by comparing contrasting similar linear and absolute value functions. Key included!
Subjects:
Grades:
7th - 12th
Types:
CCSS:
The Plumbing Problem:The Algebra Lab Manual
Maybe you are looking for an activity or lesson to give to your class before a long vacation or holiday. What about demonstrating an application of a concept just recently covered. Each Algebra Lab Manual exercise the student will be able to see the everyday application of mathematics and data analysis. The student will be able to formulate conclusions with understanding after completing each activity and provide detailed explanations for their solutions. As an option the use of spreadsheet soft
Subjects:
Grades:
7th - 11th, Adult Education
Types:
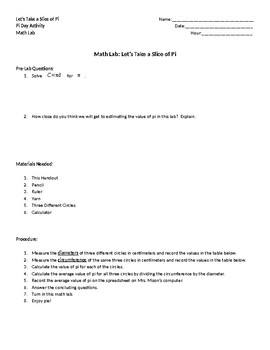
Pi Day Math Lab
This Pi Day Math Lab asks students to measure several circular objects to estimate the value of pi.
Subjects:
Grades:
7th - 12th
Types:
Showing 1-24 of 26 results


