2,025 results
11th grade algebra activities for Microsoft Word
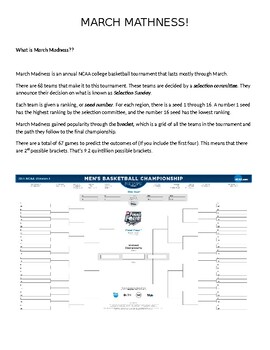
2024 March Mathness Madness NCAA Basketball Probability and Statistics Lesson
Every year I get my students excited about the NCAA Men's Basketball March Madness Tournament. I see articles written year after year from statisticians, sports journalist, celebrities, etc. about predicting the perfect bracket. Regardless that most have accepted it is nearly impossible, it has not deterred these enthusiast from finding an algorithm or a machine that can predict the outcomes.This packet guides students through 1) An explanation of what March Madness is all about2) A reading abou
Subjects:
Grades:
4th - 12th
Types:
End of Year Project
This EIGHT PROJECT BUNDLE (!!!!!) will keep your Algebra 1, Geometry, or Algebra 2 students busy for the last 1 - 3 weeks of school doing either independent or group projects, with or without access to technology. Projects include rubrics and grading criteria for the most part, although I sometimes just grade this with a daily participation grade rather than for correctness. Project topics include:
- Area and Perimeter -- Design Your Own Playground!
- Linear Modeling -- Human Height and Bone Le
Subjects:
Grades:
8th - 12th
Types:
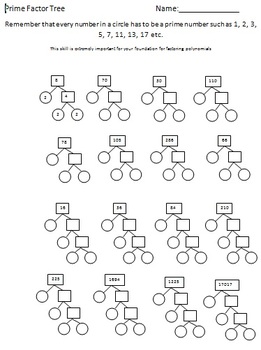
Prime Factorization (or Factor Tree)
This activity / assessment has 16 questions where the student fills in the factor tree. It is a great way to start the kids thinking about factoring polynomials. it will also tell you who knows their multiplication tables.
The students who could do these were able to factor more easily and were more likely to be able to apply it to factoring polynomials like
x^2 + 10x +21
(x+3)(x+7)
I put in an answer key too so you could leave this with a substitute teacher :-)
Subjects:
Grades:
7th - 11th
Types:
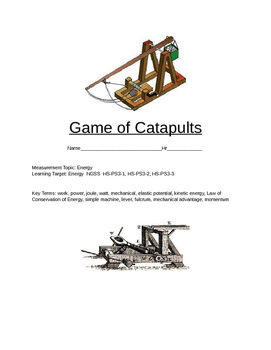
STEM Project, Making a Catapult: Force, Work, Power and Energy
This is an exciting, hands-on STEM project in which students make small catapults with classroom supplies and collect data to calculate force, work, power, momentum and kinetic energy. At the end of the project the class can set up and compete in mini battles with their catapults in whatever type of games you want to come up with. Some game suggestions are given.
Subjects:
Grades:
9th - 12th
Types:
NGSS:
HS-PS3-2
, HS-PS3-1
, HS-PS3-3

Algebra 2 Bell Ringer / Do Now / Warm Up Packet (over 400 problems)
This packet contains over 400 "Bell Ringer" problems for an Algebra 2 course. Problems are broken up into sets of six that can be done on a daily basis. Also contained in the document is a copy of the Bell Work Sheet on page three.
Students receive a Bell Work Sheet at the beginning of the week and do their work each day until they submit their sheet on Friday for the teacher to assess. Each day, the teacher can choose to review the day's problems by having students put problems on the boar
Subjects:
Grades:
9th - 12th
Types:
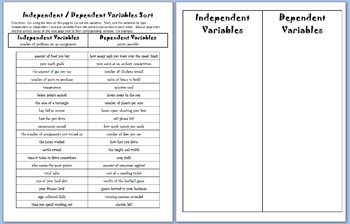
Independent and Dependent Variable Sorting Activity
Students cut out the variables from the instructions page then tape/glue them into the Independent Variables/Dependent Variables table. Variables come in pairs/from the same situation, but are completely mixed up on the page they cut them from. The direction page includes an example.
Use this activity in your Pre-Algebra, Algebra 1, or Algebra 2 class to help students practice determining if a variable is independent or dependent. Made on a full page of paper, but can be used in an interacti
Grades:
8th - 12th
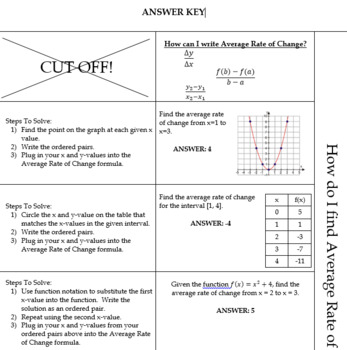
Average Rate of Change Foldable
This foldable shows students how to find the Average Rate of Change given different mediums such as a graph, table, function, and function notation. The answer key is included in this file as well as the student handout. In order to have this foldable print correctly, place papers face-up (one on top of the other), facing the same direction, and print 1-->2 sided.
Grades:
9th - 12th
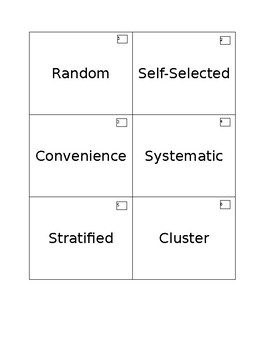
Sampling Methods Matching Activity
18 cards included. Students match six types of sampling methods (random, cluster, stratified, convenience, systematic, and self-selected) with their definitions and an example of each type. Teacher answer key included for easy assessment. When students are finished, they should have 6 groups of 3 cards each for teacher/other group to check.
Subjects:
Grades:
9th - 12th
Types:
CCSS:
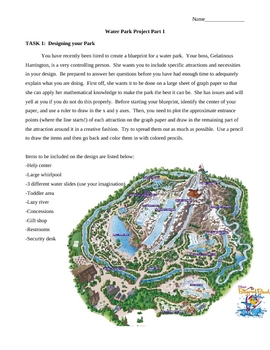
Linear Equations: Water Park Project
In this high interest, extensive assignment, students are given a three part project broken into daily tasks. The project is designed to assess the students profieciency with linear equations. They must design a water park on a coordinate plane, identify points, calculate slope, write equations, solve for midpoint, use the distance formula, and explain their results in a reflection paper.
Subjects:
Grades:
7th - 12th
Types:

Rational or Irrational? Coloring Activity
This activity asks students to determine if the given numbers are rational or irrational (8.NS.1). Students choose two colors (one for rational and one for irrational) and color code the numbered pieces of the geometric shape. There are two different sets included which could be used as a review and quick assessment in the same format. It can also be used as a classroom activity or in math centers.
Pictorial keys are included which makes grading quick and easy. Student artwork can be tessel
Grades:
8th - 11th
Types:
CCSS:
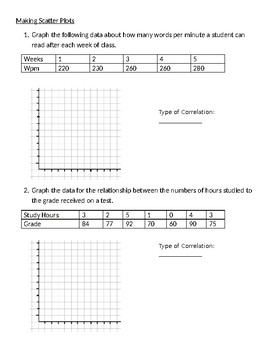
Making Scatter Plots Worksheet
2 pages of practice problems with given information to create scatter plots
Grades:
5th - 12th
Types:
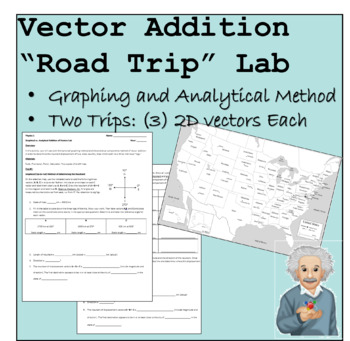
Vector Addition "Road Trip" Lab Activity
Overview:In this activity, students will use both the tip-to-tail graphing method and the analytical components method of vector addition in order to determine the resultant displacement of two, cross-country, trips which each have three individual "legs."Materials:Ruler, Protractor, Pencil, Calculator, Handout
Subjects:
Grades:
10th - 12th
Types:
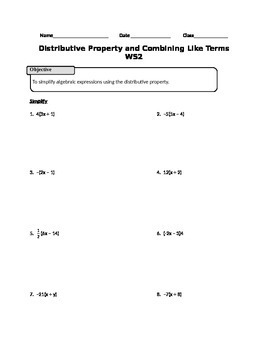
Distributive Property and Combining Like Terms WS2
Distributive Property and Combining Like Terms Practice
camfan54@att.net
I do not provide the answers as I have had an influx of students requesting them! I don't want to compromise your grading. Hope you understand.
PLEASE REVIEW and RATE!! Thanks!
Subjects:
Grades:
6th - 12th
Types:
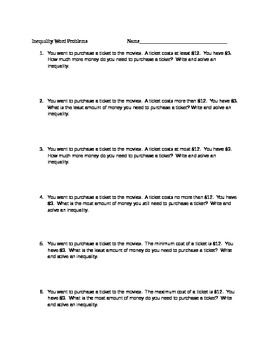
Inequality Word Problems
This worksheet has students write and solve inequalites. Students tend to get confused when the inequality says more than, a maximum, at least etc. This worksheet takes one problem and re-words it in 6 differnet ways. Very good at making sure students can write all types of inequalities when given a word problem.
Subjects:
Grades:
7th - 12th
Types:
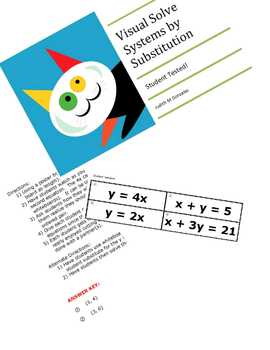
Solve Systems of Equations by Substitution Visual Activity
This is a student tested activity. Solving systems of equations with substitution can seem so abstract to students. The visual part of the activity has students actually cutting out the part that is substituted! I have taught this concept for 10+ years and this has to be the best way I have found to introduce this to students. The activity comes with directions and an answer key.
Grades:
8th - 12th
Types:
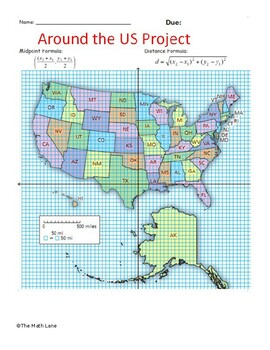
End of Year Geometry Project (Distance and Midpoint Formula), 9th, 10Math, No-pr
Geometry STEM Project. -Plan a trip around the United States calculating distance and midpoint using the appropriate formulas. Calculate the midpoint and then find a city that is close to that point on the map. Research and find at least 5 fun facts about each city as well as places to visit. -Make a presentation (google slides, powerpoint, prezi, canva, video, etc) to present your travels to the class(or your teacher) so they can learn about the cities you visited. Table included to record
Subjects:
Grades:
9th - 12th
Types:
Also included in: High School Math Projects (Algebra II and Statistics) STEM No prep
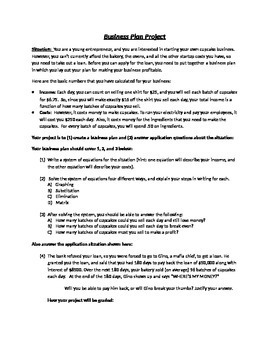
Bakery Business Plan (Systems of Equations Project)
In this project, students are presented with a situation in which they want to open a bakery, but must first write a business plan to apply for a loan. They are given the basic costs of running a business, and are then asked to write and solve a system of equations to find the number of cupcakes they need to sale to turn a profit each day. Then, they are to make judgments based on the solution to their system. Included is instructions, rubric, and technology suggestions.
Grades:
8th - 11th
Types:
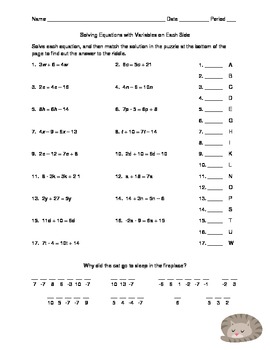
Solving Equations with Variables on Each Side Puzzle
Students practice solving equations with variables on each side. When all the of the equations have been solved, the answer to the question "Why did the cat go to sleep in the fireplace?" will be answered in the puzzle at the bottom of the page.
Grades:
7th - 12th
Types:
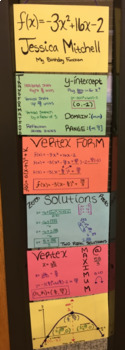
A Quadratic Project
Create a quadratic function using your birth date and the form that was assigned to you. Forms are included where you can cut out and have students draw for their form.
Project Aspects include Calculating:
Vertex Form, vertex, max/min value, domain, range, intercepts and graphing.
Rubric and Quadratic Forms Included
Subjects:
Grades:
8th - 12th, Higher Education, Adult Education, Staff
Types:
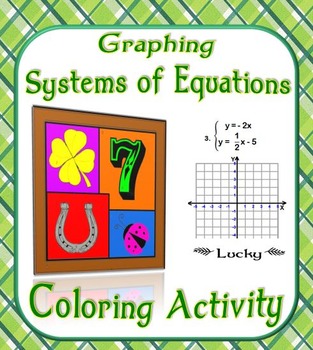
Graphing Systems of Equations Coloring Activity
This is a set of 9 systems problems that asks students to graph in both standard and slope-intercept form to find x and y. The set contains large coordinate graphs to help students graph more accurately. Students solve the problem, find the answer in the picture, and color it based upon a given table of colors.
Graphing Systems of Equations Coloring Activity by Suzie's Angle is licensed under a Creative Commons Attribution-NonCommercial-NoDerivatives 4.0 International License
Grades:
8th - 11th
Types:
CCSS:
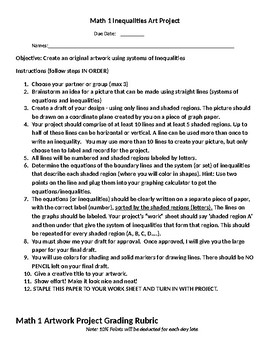
Algebra 1 Systems of Linear Inequalities Art Project
This project allows students to practice graphing systems of linear inequalities to create a picture made up of shaded areas. Includeds detailed directions and a grading rubric. I provided my students with graph paper to do their draft on, then large poster size grid paper to do their final project. Students worked in groups of 2 to 4.
Subjects:
Grades:
8th - 11th
Types:
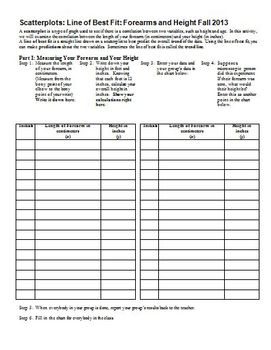
Scatterplots Linear Regression Line of Best Fit Forearms & Height (Editable)
After teaching my students about scatterplots, correlation, and the line of best fit, I take a day for them to do a hands-on lab, in which they measure their height (in inches) and their forearm length (from the tip of their elbow, to the bony point on their wrist), and we plot the class data, write the equation of the line of best fit, and then use the equation generated both forwards and backwards. They will need 45 minutes to an hour to do this in class.
I have found that if the students br
Subjects:
Grades:
7th - 12th
Types:
French Fry Scatter Plot & Best Line of Fit
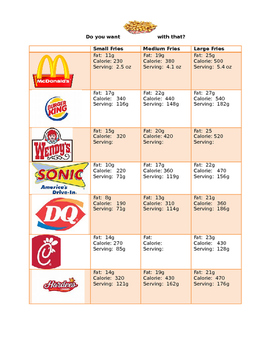
Students will compare the nutritional values and serving sizes of french fries from various fast food restaurants. Based on this information, they will create scatter plots, best lines of fit and the equation of the trend line. Using the equation, they will estimate the unknown values of kid meals and supersized portions of french fries.
Subjects:
Grades:
8th - 11th
Types:
Adding and Subtracting Polynomials (Guided Notes & Algebra Tile Activity)
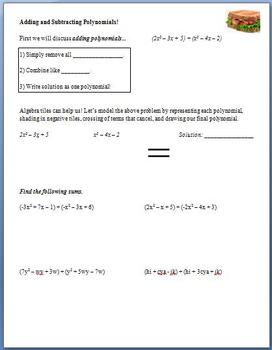
This lesson is meant to be used as guided notes for a whole class, with an algebra tile activity at the end.Students begin by learning how to add polynomials. They are taught how to model this sum using algebra tiles, and then they find a few more sums. Next, they do the same thing, except with differences of polynomials. After the guided notes is a 2 page algebra tile activity/assignment/assessment. The last 2 pages are a copy of the key for the guided notes.Related activity:Polynomial Operati
Subjects:
Grades:
7th - 11th
Showing 1-24 of 2,025 results


