58 results
3rd grade graphing centers for Easel Activities
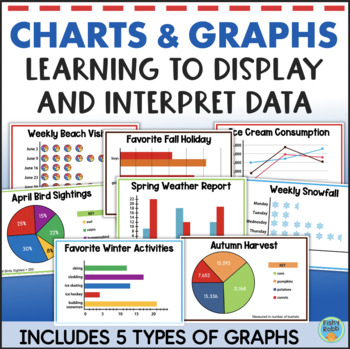
Math Graphing Activities Interpreting Graphs and Data Worksheets Line Pie Bar
Representing and interpreting data using graphs and charts is the focus of this math resource for upper elementary grades. It helps students explore and understand data analysis. For each activity, students will use a graph to answer questions about the data. They will also create another type of graph, chart, or table based on the information provided. This added step really helps students understand the various types of graphs and ways in which data can be displayed.These activities are perfec
Subjects:
Grades:
3rd - 5th
Types:
Also included in: Third Grade Math & Reading YEAR LONG BUNDLE 1500+ Pages
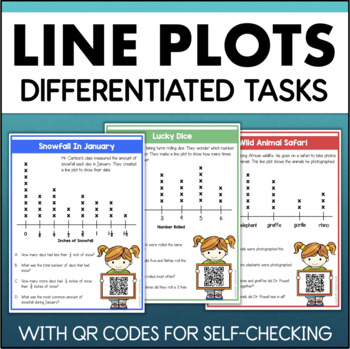
LINE PLOT Practice Activities with Fractions & Data Task Cards Worksheets
This math resource provides a scaffolded introduction to using line plots for organizing and interpreting data. The activities move from simple categorial data to more complex line plots with fractions.Each full-page card includes a data set presented in a line plot, along with 4 questions for students to answer. These questions require students to interpret and compare the data. FEATURES OF THIS RESOURCE:differentiatedability to self-checkdigital versionINCLUDES:There are 15 line plot cards div
Subjects:
Grades:
2nd - 4th
Types:
Also included in: Third Grade Math & Reading YEAR LONG BUNDLE 1500+ Pages
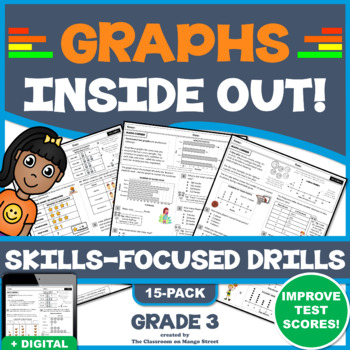
3RD GRADE GRAPHS: BAR, PICTURE, & LINE PLOTS - 15 Skills-Boosting Worksheets
Students will complete word problems related to bar graphs, pictographs, line/dot plots and tally charts. This includes reading and interpreting data, performing calculations, matching data to and representing data in graphs. Use these scaffolded math drills to teach and reinforce the fundamentals, or prep for test day. Each drill begins with a mini-lesson followed by several Common Core designed, simulated test questions (including multi-part & open response). These practice worksheets
Subjects:
Grades:
3rd - 4th
Types:
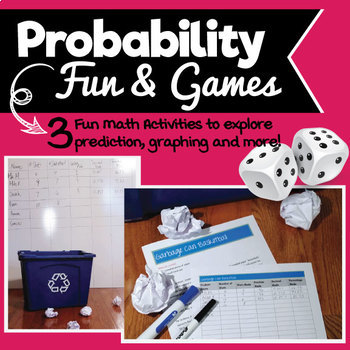
Probability Fun & Games! Exploring fractions, decimals, percentages & more!
Probability Fun & Games reinforces the concepts of: addition, prediction, graphing, fractions, decimals, and percents through three fun activities. Your students will be on the fast track to learning basic math skills. The packet include three activities - Roll Them Bones, Trash Can Basketball and What Color is Your Candy.
Included in this download are:
• Note to teacher with tips on using lessons
• Three activities with instructions
• Discussion prompts
• Ready-made charts for students to
Subjects:
Grades:
3rd - 8th
Types:
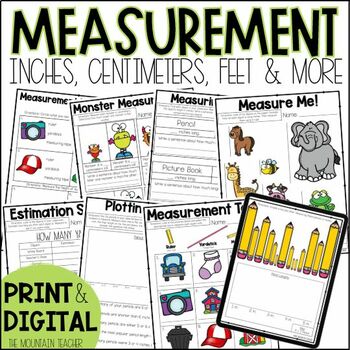
Measurement Worksheets, Anchor Charts & Assessments for 2nd Grade
Need some helpful measurement worksheets and anchor charts for your 2nd grade students? This 2 week unit is filled with printable and digital measurement worksheets, assessments and hands-on activities covering using a ruler, inches, centimeters, comparing lengths, length, width, height, estimating, line plots, selecting the correct tool, and more.What's Included in the Measurement Worksheets:23 Page Digital Workbook (9 Printable Worksheets PDF)Digital/Printable Pre and Post TestTeaching GuideAn
Subjects:
Grades:
1st - 3rd
Types:
Also included in: 2nd Grade Math Worksheets and Lessons YEAR BUNDLE Print and Digital
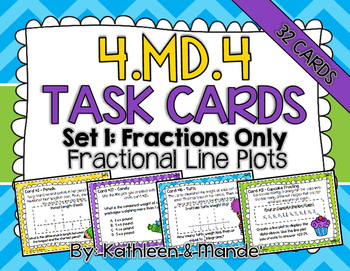
4.MD.4 Task Cards: Fractional Line Plots {Set 1: Fractions Only}
Looking for a fun, engaging way for your students to practice creating and interpreting fractional line plots? Your students will love practicing with these adorable, easy to use task cards. These 32 task cards are aligned to CCSS 4.MD.4: Fractional Line Plots.Do you want to assess the quality of our task cards before you buy? Try our {FREEBIE} 4.NF.7 Task Cards: Compare & Order Decimals. - - - - - - - - - - - - - - - - - - - - - - - - - - - - - - - - - - - - - - - - - - - - - - - - - - - -
Subjects:
Grades:
3rd - 5th
Types:
Also included in: 4.MD.4 BUNDLE: Fractional Line Plots
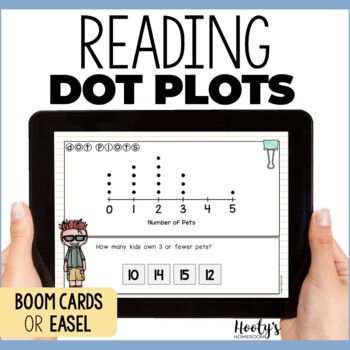
Dot Plot Digital Activities - 3rd Grade Line Plot Boom Cards & Easel Practice
Understanding dot plots can be tricky! Give your students the line plot practice they need to master this skill. These line plot digital task cards are perfect for 3rd grade students who are learning about dot plots. Boom Cards and Easel activities are self-checking and give students immediate feedback so they can improve as they practice. More options!These dot plot activities have been updated to give you more options. You can choose from BoomCards, Easel Activities, and Easel Assessments. The
Grades:
3rd - 4th
Also included in: 3rd Grade Math Boom Cards Bundle
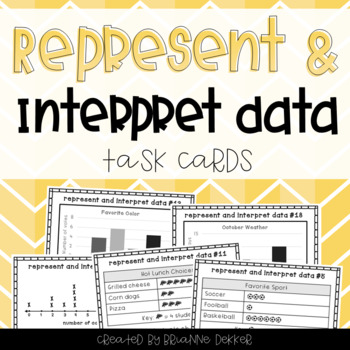
Represent and Interpret Data Task Cards
These 24 task cards target representing and interpreting data, aligned with the Grade 3 GoMath curriculum, Chapter 2. They include practice with reading and creating picture graphs and bar graphs as well as solving problems based on data, graphs, and line plots.
A recording sheet and answer key are included.
***
You might also be interested in:
- Represent and Interpret Data worksheets - $1
- Graphing the Weather Worksheets and Projects - $2
Would you like credit for future purchases?
Don'
Subjects:
Grades:
2nd - 4th
Types:
CCSS:
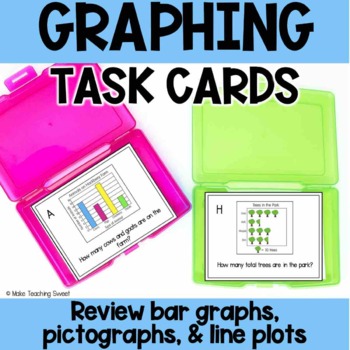
Graphing Task Cards - Interpreting Bar Graphs, Picture Graphs, Line Plots
Interpreting data doesn't have to be boring! Add these engaging task cards to your graphing unit! The task cards review bar graphs, pictographs, and line plots using these graphing task cards! Perfect to use as a whole group review, with a small group or in a math center. Teaching students to analyze data on graphs can be such a fun unit - but using the same graphs gets boring! Each task card features a different graph so your students will have a fun, hands-on way to practice reading graphs an
Subjects:
Grades:
1st - 4th
Types:
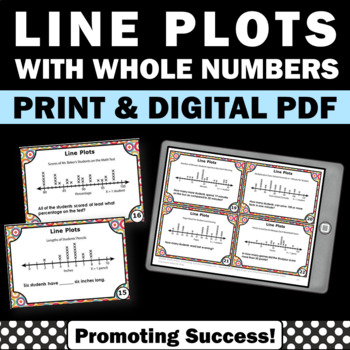
Line Plots Measurement Activities Interpreting Data and Charts Math Task Cards
DIGITAL PDF AND PRINTABLE PACKET: You will download 30 task cards (digital and print) for your 2nd or 3rd grade students to practice interpreting line plots with whole numbers. You may use the printable task cards in math centers or stations for fun practice and review games and activities, such as a scavenger hunt or SCOOT. They also work well for transition activities, as exit tickets, for morning work, and as quick formative assessments. Game ideas, a student response form and answer key are
Subjects:
Grades:
2nd - 3rd
Types:
CCSS:
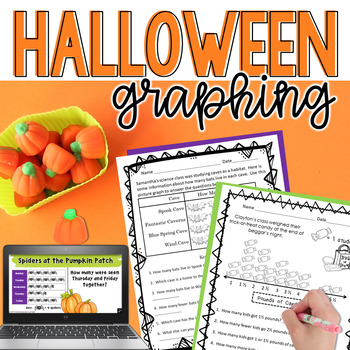
Halloween Graphing- Digital AND Printable Math Activities
Students will love creating and interpreting their own bar graphs, pictographs (picture graphs), and line plots with fractions on a number line! Printable worksheets, Digital Google Slides, and TpT Easel versions are all included in this fun Halloween Math Activity!Quickly print the Halloween math worksheets for centers, homework, morning work, bell ringers, or emergency sub plans. Or easily assign in Google Classroom or TpT Easel! Perfect for the whole month of October!Topics include Halloween
Subjects:
Grades:
3rd - 5th
Types:
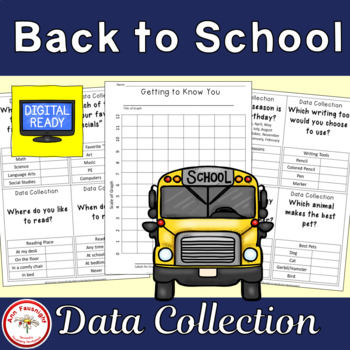
Back to School Getting to Know You Data Collections and Graphs
This product is ready for distance learning. Check out the TpT Digital Activity button. I have already created a student-friendly digital activity with directions and answer boxes that can be used through Google Classroom.This packet has 28 different questions about Back to School for students to use for data collection. The questions are on ¼ of a page, so that the teacher only needs to use up to 7 sheets of paper for this part of the activity. A blank sheet is also included for your own ideas.
Subjects:
Grades:
3rd - 5th
Also included in: Back to School Bundle
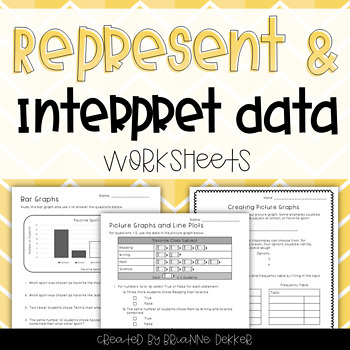
Represent and Interpret Data Worksheets
I created these four worksheets to go along with my Grade 3 GoMath curriculum, Chapter 2. This product includes a worksheet each on bar graphs, picture graphs, and line plots, and a project for creating picture graphs. Students will practice using and making tally tables, frequency tables, graphs, and line plots, as well as answer questions based on the data.
Answer keys are included for all worksheets.
*This product is included in my Math Worksheets Bundle. Click here for more information!*
Subjects:
Grades:
2nd - 4th
Types:
Also included in: Math Worksheets Bundle
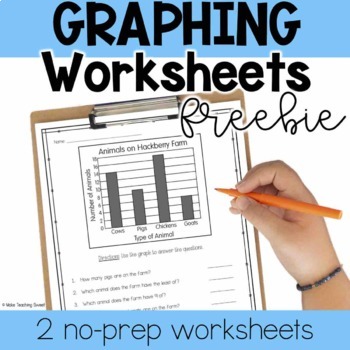
Graphing Worksheets - Interpreting Bar Graphs and Picture Graphs - Freebie!
Ready to review bar graphs & picture graphs in your graphing unit? These 2 no-prep black & white worksheets are perfect to see what students can do! Practice reading & analyzing bar graphs and picture graphs. Use as independent practice, as a math center, a formative assessment, or however you choose!Choose the worksheet that your students need - this freebie makes it easy to differentiate! This file includes a graph with a scale of 2 for early learners, as well as a graph with a sc
Grades:
1st - 4th
Types:
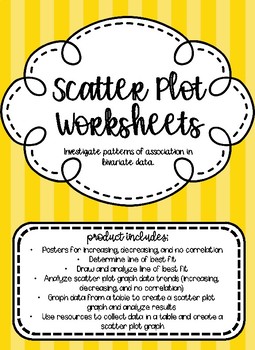
Scatter Plot Graph Worksheets
A collection of worksheets to use when teaching how to investigate patterns of association in bivariate data. Product includes 3 posters for students to reference how to determine if data is increasing, decreasing, or has no correlation. Types of worksheets include:
-Determine line of best fit
-Draw and analyze line of best fit
-Analyze scatter plot graph data trends (increasing, decreasing, and no correlation)
-Graph data from a table to create a scatter plot graph and analyze results
-Use reso
Subjects:
Grades:
1st - 12th
Types:
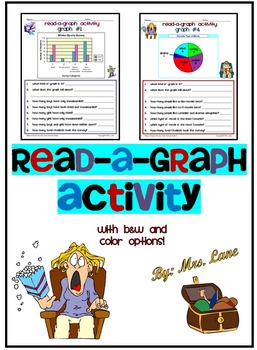
Read-a-Graph Activity
Are your students learning about graphs? Make it FUN with this ready-to-use activity!
================================================
*THIS PRODUCT INCLUDES:
Teacher Directions
Student Directions
Graph Activity Sheets (Bar Graph, Line Graph, Pictograph, Pie Graph)
Answer Key
*Includes color AND black and white printing options!
================================================
-14 pages total.
*NOTE: THE SAMPLE FILE DOES NOT INCLUDE ALL OF THE PAGES THAT YOU WILL RECEIVE IN THE FINAL PUR
Subjects:
Grades:
1st - 4th
Types:
Climate Graphing Activity
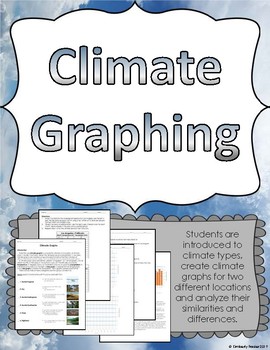
Help students understand the basics of climate through this graphing activity. Not only does this address the science standards, it also integrates math and data analysis.Included in this printable graphing activity:-Introduction to what climate graphs are-Descriptions of 6 major types of climates-Directions for how to make a climate graph-Climate graph set ups-Data for two locations: New York City and Los Angeles-Analysis questions comparing the two climate graphs (use of CER)-Set of climate gr
Subjects:
Grades:
3rd - 9th
Types:
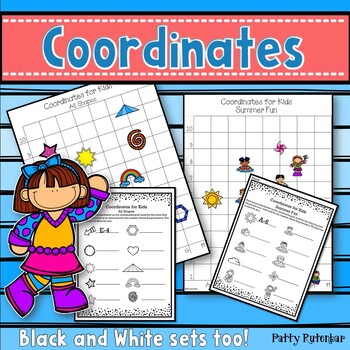
Coordinates for Kids Quick and Easy (Color and BW)
Coordinates are a set of values that show an exact position. The pictures are placed on a point on the chart. Students will line up the point between the horizontal and vertical lines to see where specifically where the picture is sitting.This set of 12 different maps or charts will help your young students find the exact position of the pictures. They will use coordinate skills to locate and identify the location. This set was updated in July 2022. It now includes a black and white version of
Subjects:
Grades:
1st - 3rd
Types:
CCSS:
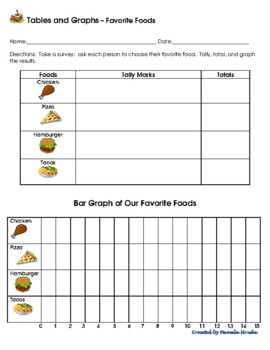
2 Tally Marks Tables & Bar Graphs - Favorite foods & desserts
2 Tally Marks Tables & Bar Graphs – Favorite Foods & Favorite DessertsVocabulary: survey, data, tally marks, bar graph. Directions: Activate prior knowledge about vocabulary words; display student answers. Discuss what it means to take a survey. How can we display our data? Explore different types of graphs (bar, line, picture, pie, histogram). Discuss/model tally marks. How do we use them? How does skip-counting help us here? Students take a survey of their classmates’ favorite food (or
Subjects:
Grades:
K - 3rd
Types:
Also included in: 7 Tally Marks Tables & Longitudinal Bar Graphs BUNDLE
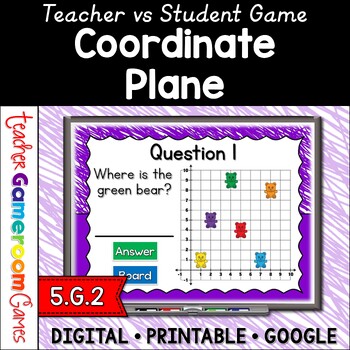
Coordinate Plane Powerpoint Game | No Prep Digital Resources
Student practice using 4 different coordinate planes. Each includes 6 objects to find. Students answer two types of questions: where is OBJECT, and what is located at (#,#). There are 21 questions in all (5 per graph), and you just click on each question to go to it. The question disappears after you've clicked on it, so you know you've answered it. The scoreboard allows you to type in scores during Slideshow Mode. Great for a math centers or as a whole class review activity. Great for individu
Grades:
1st - 4th
Types:
Also included in: Graphs Bundle | No Prep Digital Resources
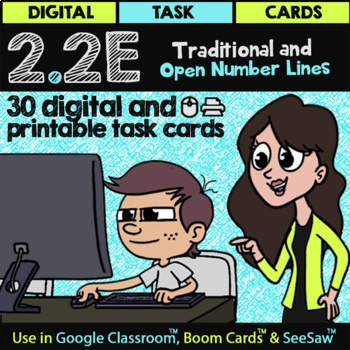
Traditional & Open Number Lines for Google Slides™ & Boom Cards™ | Math TEK 2.2E
Are you looking for a highly-engaging activity for your students that is directly aligned to Math TEK 2.2E (Traditional & Open Number Lines) and can be set up in a instant, freeing you from long hours of repetitive grading?Beyond just saving time, these cards are highly effective at providing the practice your students need to move to mastery of the 2.2E standard. All questions have been thoughtfully differentiated into 3 levels of rigor, allowing your class to build confidence in their skil
Subjects:
Grades:
2nd - 3rd
Types:
Pictograph Bar Graph Task Cards (TEKS 2.10ABCD)
10 Pictograph Cards with Questions, 10 Bar Graph Cards with Questions
50 QUESTIONS!!!!
2.10 B-The student will organize a collection of data with up to 4 categories using pictographs and bar graphs with intervals of one or more
2.10 C-The student will write and solve one step word problems involving addition or subtraction using data represented within pictographs and bar graphs with intervals of one.
2.10 D-The student will draw conclusions and make predictions from information in a graph
Subjects:
Grades:
2nd - 5th
Types:
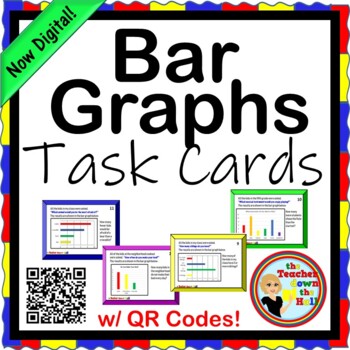
Bar Graphs Task Cards w/ QR Codes NOW Digital!
**NOW FORMATTED FOR YOUR DISTANCE LEARNING NEEDS!** Need a fun, independent way for your students to practice analyzing bar graphs? Students will read about a survey that has been conducted and view the results in a bar graph. Then they'll answer questions that could require addition, subtraction, and multiplication to solve correctly. Lots of visual graphing practice! Great for math centers!There are 24 self-checking cards. They can check their own answers using the QR codes or turn in com
Subjects:
Grades:
3rd - 5th
Types:
CCSS:
Bug Hunt Maths and Science Investigation
A cross-curricular maths and science investigation that will get your class into the great outdoors on a bug hunt. They will learn about data handling, graphing (bar charts), estimation, averages, and basic number skills as they search for, and record, the different species of insects that they find. Your class are sure to love this exciting investigation!
Contents
- 4 Large Icon Insect Identification Sheets
- 1 Small Icon Insect Identification Sheet
- Instruction Sheet
- Planning Sheet
- Resu
Grades:
2nd - 5th
Types:
Showing 1-24 of 58 results


