Graphing Worksheets - Interpreting Bar Graphs and Picture Graphs - Freebie!
- PDF
- Easel Activity
Description
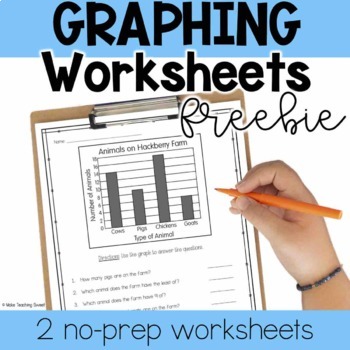
Ready to review bar graphs & picture graphs in your graphing unit? These 2 no-prep black & white worksheets are perfect to see what students can do! Practice reading & analyzing bar graphs and picture graphs. Use as independent practice, as a math center, a formative assessment, or however you choose!
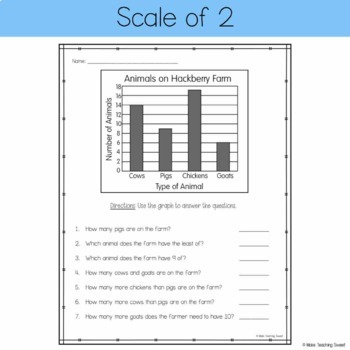
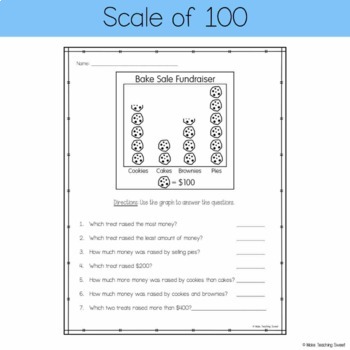
Choose the worksheet that your students need - this freebie makes it easy to differentiate! This file includes a graph with a scale of 2 for early learners, as well as a graph with a scale of 100. Need more practice? Check out other graphing resources below!
This freebie includes:
- Bar Graph with a scale of 2 & 7 questions
- Picture Graph with a scale of 100 & 7 questions
- Answer Keys for both graphs
Use these worksheets as independent practice after a lesson, as homework during a graphing unit, as a formative assessment, or however you choose! These worksheets are ready to use - just print, copy, & go! All worksheets are in printer-friendly black & white and include an answer key.
You'll love how easy to use these worksheets are and how quickly you'll be able to see what your students have mastered.
Teachers are saying:
⭐️⭐️⭐️⭐️⭐️ "I am so excited about this FREEBIE! It was a great assessment tool for me as I wanted to review what they remembered. Thank you for clear graphics and great questions."
⭐️⭐️⭐️⭐️⭐️ "My students were well-engaged in this activity. It was easy-to-use and required little prep time. Strongly recommend the use of this activity to meet the standards identified."
These freebies are a sample of a larger resource of graphing worksheets - check them out below!
More graphing worksheets:
Graphing Worksheets Set 1 includes 15 no-prep worksheets with smaller numbers and scales of 1, 2, 5, & 10.
Graphing Worksheets Set 2 includes 21 no-prep worksheets with larger numbers and scales of 4, 5, 10, 20, 25, 50, 100, & 200
More graphing resources:
Create a Graph Worksheets: Set 1
Create a Graph Worksheets: Set 2
©Make Teaching Sweet
Permission to copy for a single classroom only.


