235 results
Common Core 7.SP.B.4 activity pdfs
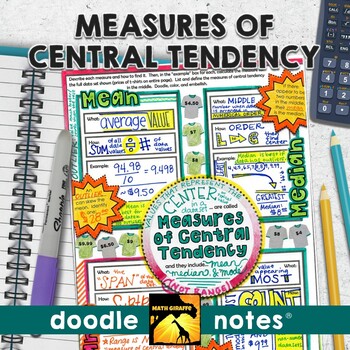
Measures of Central Tendency Doodle Notes (Mean, Median, Mode, & Range)
Mean, Median, Mode, and Range (Measures of Central Tendency): "doodle notes" - visual note taking pages with interactive tasks for building stronger retention of measures of center (mean, median, mode, and range) for your middle school statistics unit in Pre-AlgebraBoost your students' focus and memory! The blend of graphic and linguistic input in these guided visual notes helps students' brains to convert the information to long-term memory more easily.When students color or doodle in math clas
Subjects:
Grades:
6th - 8th
7th Grade MATH End of Year Summative Project + Distance learning
****Over 1200 sold! Get this product for cheap while you can!!!*****This is a great summer school packet as well! *If you are looking for 6th grade project or a remediation project check out my 6th grade end of year summative project!**If you are pre-planning for next year, Check out the discounted Spiraled Common Core 7th Grade Bell Ringers**Geometric Dream House Project! After Testing is finished, your students don't want to work on worksheets or regular skill and drill. Instead, they want to
Subjects:
Grades:
6th - 8th
Types:
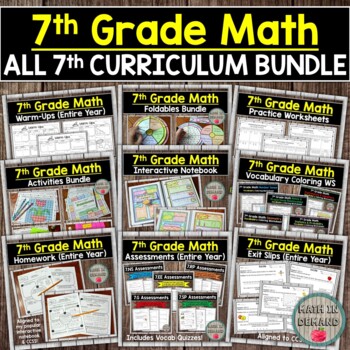
All 7th Grade Math Curriculum Bundle
⭐ This bundle includes ALL of my 7th Grade Math material in my store and ALL future 7th Grade Math Products ⭐This includes all of my popular 7th grade math interactive notebooks, practice worksheets, foldables, activities, warm-ups, homework, exit slips, assessments, early finishers, and SO MUCH MORE!!! You can use this bundle as a stand alone curriculum for the entire school year or you can use it to supplement your current curriculum.This bundle includes ALL of the following:• 7th Grade Math A
Subjects:
Grades:
6th - 9th
Types:
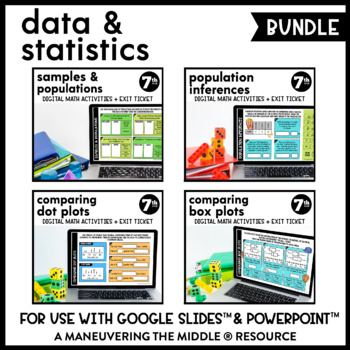
Data & Statistics Digital Math Activity Bundle | Samples & Populations
These supplemental digital math activities can be used to support data and statistics concepts. They are interactive (drag and match, using the typing tool, using the shape tool) and paperless through Google Slides™ and PowerPoint™. Topics Included:Samples and Populations (4 interactive slides + exit ticket)Drawing Inferences (4 interactive slides + exit ticket)Comparing Dot Plots (4 interactive slides + exit ticket)Comparing Box Plots (4 interactive slides + exit ticket)What is included?1. Pap
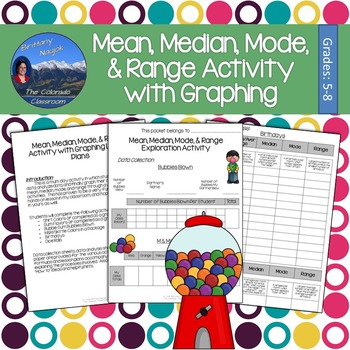
Mean Median Mode and Range Exploration Lab & Graphing Activity
Mean, median, mode, and range are explored in this activity lesson pack complete with lesson plans, student packets, and graphing pages. You and your students will tackle these four important measures of central tendency through a fun lab activity involving bubble gum, M&Ms, birthdays, dice, and more. Students will collect data, analyze their data, and then graph their results all while learning about the mean, median, mode, and range of various scenarios.This activity is prepared and read
Subjects:
Grades:
5th - 8th
Types:
⭐NO PREP Statistics & Probability Escape Room {7th Grade Math}⭐
PDF AND GOOGLE FORM CODE INCLUDED. It is a great way for students to work together and review their knowledge of statistics & probability. There are a total of 4 tasks/puzzles included as well as a Google Form Code if you want to do the whole thing digitally with no paper. If you would rather use paper all you have to do is print and you are ready to go, no prep needed! All of the tasks/puzzles are included in a PDF for quick printing.Topics Covered:- Statistics & Probability Vocabulary-
Subjects:
Grades:
7th
Types:
Also included in: 7th Grade Math Escape Rooms Bundle ★ Digital and Printable
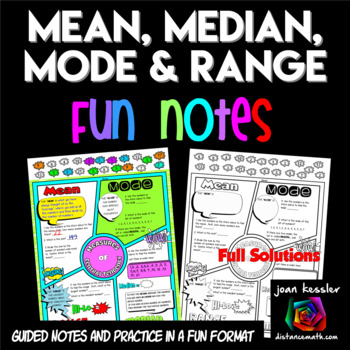
Measures of Central Tendency FUN Notes Doodle Pages
Your students will love learning the Measures of Central Tendency with these Fun Notes done in a comic book theme. Topics include Mean, Median, Mode, and Range. Students complete 6 problems plus definitions. There are two versions of the notes so you can differentiate. The PDF also includes 2 sizes, one standard 81/2 x 11" and the other in half size for INB's. Students love to doodle while learning and it has been shown that doodling and working with fun themed activities help students engage
Subjects:
Grades:
6th - 9th
Also included in: Algebra 1 FUN Notes Doodle Page Bundle
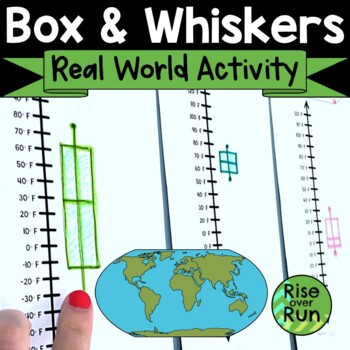
Box and Whiskers Plot Activity with Real World Data Comparisons
Help students understand how and why to use box & whiskers plots with this real world application using data about temperatures in different cities. Students use data about the highest average temperature for each month in a city. They locate it on a world map and then create a vertical box plot using the vertical number line provided. Once students create their individual cities’ box plots, all the data can be displayed on a wall for comparison. This leads to some great discussions about t
Subjects:
Grades:
6th - 7th
Types:
Also included in: Algebra 1 and 8th Grade Math Curriculum Bundle for Entire Year
Math Escape Room Probability and Statistics | Digital and Print
Do you love using Escape Room activities, but hate the prep? Or are you looking to implement an Escape Room for the first time, but aren’t sure where to start? Then look no further, this resource is low prep, highly engaging, and so easy to implement (even if it’s your first time). This escape includes a tech-free and technology version and requires no lockboxes or elaborate setups! Essentially, students will work through 5 levels of rigorous questions and along the way gather a 5-digit to unloc
Subjects:
Grades:
7th
Types:
Also included in: Math Escape Room Bundle | Digital and Print | 7th Grade
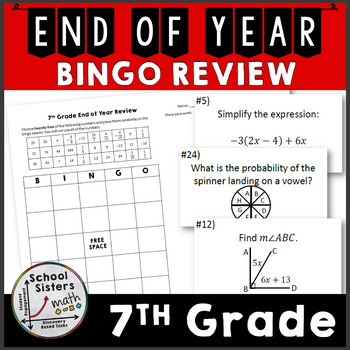
7th Grade Math End of Year Review - BINGO and Task Cards
Are you looking for an engaging activity to help your 7th graders get ready for end of year state testing? This 7th grade math bingo game is a great way to review for end of year state testing or just have a fun review day at the end of the year!! This resource will make your life easier because it is an easy, no prep printable resource, including 30 task cards and a BINGO game board. Students will create their own BINGO game sheet so you won't need to spend hours preparing that. This bingo game
Subjects:
Grades:
6th - 8th
Types:
Also included in: 7th Grade Math End of Year Level Review Activity Bundle
End of Year Math Review 7th Grade Booklet
This End of Year Math Review is intended to help students understand how to answer assessment questions based on the seventh grade Common Core State Standards. Students also review key vocabulary words and assess their understanding of all seventh grade Common Core State Benchmarks. This End of Year Math Review Features: 60 CCSS Math Review Questions Teacher facilitated activity for 60-90 minutes of classroom time or Independent Activity for Students as Bellwork, Classwork, or Homework to
Subjects:
Grades:
7th
Types:
Entire Math Curriculum Bundle (All Math Resources)
⭐ This bundle includes ALL of my Math Curriculum in my Teachers Pay Teachers store ⭐You will be receiving ALL of my 6th, 7th, and 8th Grade Math interactive notebooks, activities, foldables, practice worksheets, warm-ups, exit slips, assessments, and much more! This is well over 1000 pages of material that I have created to help make math more enjoyable to students. My material also helps students to make connections to the real world.In addition to all of the math material in my store, you will
Subjects:
Grades:
5th - 10th
Types:
7th Grade Digital Escape Room Math Activity - Mixed Review
I am excited to share this end of the year DIGITAL ESCAPE ROOM activity with you and your students! It is completely digital (using Google Forms) and paperless which means no prep work for you. It is easy and self grading. Just send the link to your students and they can get started. This is based on going to an amusement park. There is a story that tells about you wanting to have an amazing day at an amusement park. Completing a task will "unlock" a ride that you can go on. The tasks are a mixe
Subjects:
Grades:
7th
Types:
Also included in: End of the Year 7th Grade Math Activity: Digital Escape Rooms BUNDLE
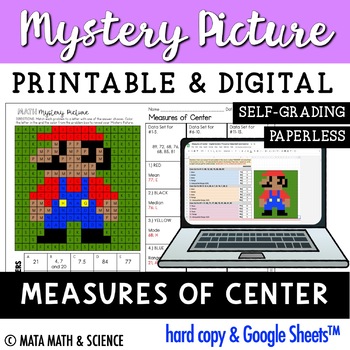
Measures of Center: Math Mystery Picture
About this resource:In this challenge, students solve 15 measures of center problems, finding the mean, median, mode, range and interquartile range (IQR) of three different data sets. Each correct answer will reveal a bit of the mystery picture. Students will be motivated to complete the math problems until all pixels are revealed!What's included?Printable Mystery PictureGoogle Sheets™ versionInteractive Notebook Cover SheetShow work templates (small and large boxes)Answer keyStandards alignment
Subjects:
Grades:
6th - 9th
Also included in: Every Single Math Mystery Picture: Growing MEGA BUNDLE for Middle School
Data Analysis Task Cards
Data Analysis Task Cards
This is a set of 24 task cards covering multiple representations of data analysis including stem-and-leaf plots, box-and-whisker plots, line plots, and measures of central tendency. The questions are differentiated for a wide range of learners. These cards would be great for bell ringers, math stations, test prep, review, or just for fun!
What you get:
➸ 24 color task cards
➸ 24 black and white task cards
➸ Student answer sheet
➸ Key
You can laminate these and use th
Subjects:
Grades:
5th - 9th
Types:
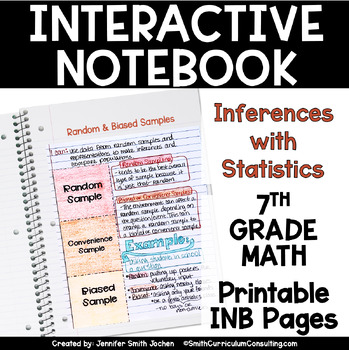
7th Grade Math Inferences & Statistics Interactive Notebook Unit TEKS PRINTABLE
Inferences with Statistics is an extensive unit to allow students to further their understanding of data and understanding how to decipher the statistics that follow along. Breaking down how to interpret the data and analyze it to allow it to be discerned is an important lesson as they continue through their math career. This Inferences with Statistics unit contains 10 unique lessons that have been tried and tested since 2012 inside and outside my own personal classroom. The interactive and kine
Subjects:
Grades:
7th
Also included in: Middle School Math Interactive Notebook Bundle - 6th 7th 8th TEKS CCSS
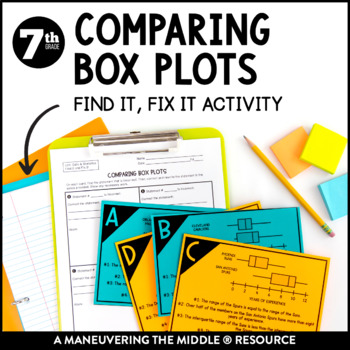
Comparing and Analyzing Box Plots Error Analysis | 7th Grade Data Activity
This Comparing Box Plots Find It, Fix It Activity consists of 10 cards where students must analyze and correct errors as they review box plots in a fun and hands-on setting. Students will apply numerical data analysis concepts to find the statement with an error and then correct the error. This activity works best in a collaborative setting where students will use mathematical discourse to discuss and defend their responses. An excellent way to incorporate higher level thinking skills! Students
Subjects:
Grades:
7th
Types:
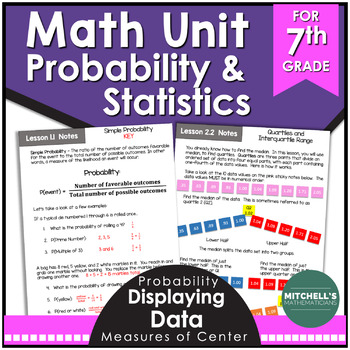
7th Grade Probability and Statistics Math Unit
In this 7th grade math NO PREP product you get an entire unit on statistics and probability. This common core aligned product will engage your seventh grade students. All you have to do is print these for your students and start teaching. This unit is exactly what you need to teach the CCSS in your classroom. Each lesson focuses on specific standards with notes to introduce the topic, practice pages to reinforce what was taught, and answer keys to make discussions and grading easy.An overview
Subjects:
Grades:
6th - 8th
Types:
Also included in: 7th Grade Math Curriculum Common Core Aligned BUNDLE
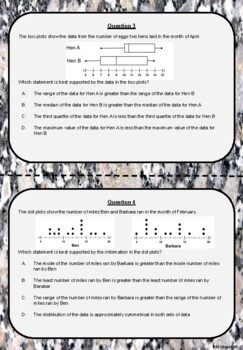
7.12A Math Comparing Dot Plots and Box Plots Task Cards
This is an 18 question task card activity that focuses on comparing dot plots and box plots. This activity aligns 100% to questions that are on STAAR Math 7th grade. I hope you like my product!!Be sure to check out my FULL lesson plan for teaching 7.12A!! This includes these task cards, a pixel art activity, and much much more!!
Subjects:
Grades:
7th
Types:
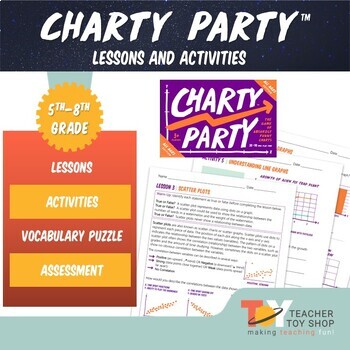
Graphing Lessons and Activities for Charty Party Game
Explore the engaging world of graphing with these Graphing Lessons and Activities for Charty Party Game, featuring nine interactive lessons that seamlessly blend learning with the excitement of a party game. Designed to teach line graphs, bar graphs, scatterplots, and more, these lessons are presented in kid-friendly language, making graphing concepts accessible and enjoyable for students. As they analyze graphs during the Charty Party™ game, students not only practice graphing but also delve in
Subjects:
Grades:
6th - 8th
Types:
NGSS:
MS-ESS3-2
, MS-ETS1-3
Also included in: Physical Science Activities and Lessons Bundle
Quartiles, Interquartile Range (IQR), & Outliers
Straightforward sixth grade materials on quartiles, interquartile range (IQR), and the outlier calculation are very hard to find. I wrote these student pages to introduce these concepts in my statistics unit. The only prerequisite is how to find the median of a set of data.
Subjects:
Grades:
6th - 7th
Types:
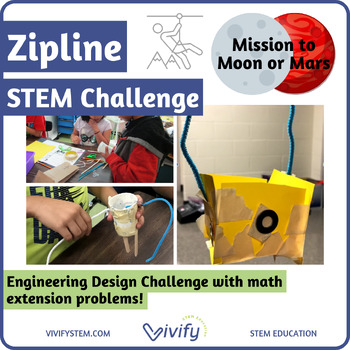
Zip Line STEM Activity: Moon Mars Mission (Save the Astronaut!)
Zip Line STEM Activity - perfect for Middle School distance learning!Your mission: Save a hurt astronaut with the use of a zipline! Includes a Moon and Mars version.Supports Distance Learning: Editable Google Slides for a digital STEM JournalScience background: Students first learn about the science of zip lines including the center of gravity and the forces acting on the vehicle such as friction and gravity. These concepts help inform the vehicle designs. Engineering Challenge: Using common mat
Subjects:
Grades:
5th - 9th
Types:
NGSS:
MS-ETS1-2
, 3-5-ETS1-3
, MS-ETS1-4
, 3-5-ETS1-1
, MS-ETS1-1
...
Also included in: Space STEM Starter Challenges MEGA Bundle: Middle School
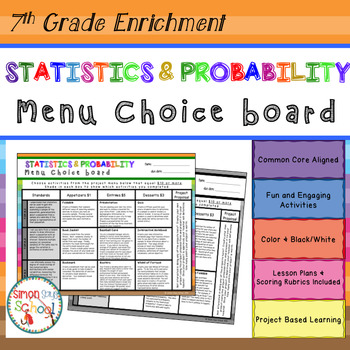
7th Grade Statistics and Probability Choice Board - Distance Learning
Statistics and Probability Enrichment Choice Board – Seventh Grade– This enrichment menu project is an amazing differentiation tool that not only empowers students through choice but also meets their individual needs. You will find that the statistics and probability enrichment board contains three leveled activities for each standard: appetizer, entrée, and dessert. No two activities are alike!Students can either choose to complete activities from the project menu or design their own project
Subjects:
Grades:
7th
Types:
Also included in: 7th Grade Math Choice Boards Bundle - ALL STANDARDS - Distance Learning

Statistics Survey Project - Project Based Learning (PBL) with Math
Watch your students dive into the world of math as they create, execute, and analyze their own survey! Students will demonstrate mastery of data gathering, survey sampling, developing appropriate survey questions, data tables, Direct Variation, discrete graphs, dot plots, box and whisker graphs, and calculating the inter-quartile range.The Unique Survey Project is highly engaging, capitalizing on the innate curiosity of the adolescent mind. You will love the low-prep instructional guide. Your st
Subjects:
Grades:
6th - 10th
Types:
Also included in: Fun with Ratios Activities Bundle - 7th Grade PBL with Math
Showing 1-24 of 235 results

