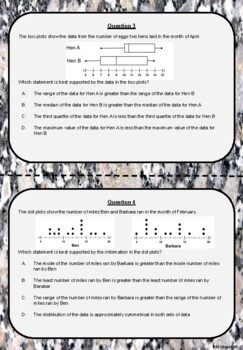
7.12A Math Comparing Dot Plots and Box Plots Task Cards
McBeee Math
300 Followers
Grade Levels
7th, Homeschool
Subjects
Resource Type
Standards
CCSS7.SP.B.3
CCSS7.SP.B.4
Formats Included
- PDF
McBeee Math
300 Followers
Description
This is an 18 question task card activity that focuses on comparing dot plots and box plots. This activity aligns 100% to questions that are on STAAR Math 7th grade. I hope you like my product!!
Be sure to check out my FULL lesson plan for teaching 7.12A!! This includes these task cards, a pixel art activity, and much much more!!
Total Pages
Answer Key
N/A
Teaching Duration
N/A
Report this resource to TPT
Reported resources will be reviewed by our team. Report this resource to let us know if this resource violates TPT’s content guidelines.
Standards
to see state-specific standards (only available in the US).
CCSS7.SP.B.3
Informally assess the degree of visual overlap of two numerical data distributions with similar variabilities, measuring the difference between the centers by expressing it as a multiple of a measure of variability. For example, the mean height of players on the basketball team is 10 cm greater than the mean height of players on the soccer team, about twice the variability (mean absolute deviation) on either team; on a dot plot, the separation between the two distributions of heights is noticeable.
CCSS7.SP.B.4
Use measures of center and measures of variability for numerical data from random samples to draw informal comparative inferences about two populations. For example, decide whether the words in a chapter of a seventh-grade science book are generally longer than the words in a chapter of a fourth-grade science book.


