71 results
Elementary statistics lectures by TpT sellers for TpT sellers
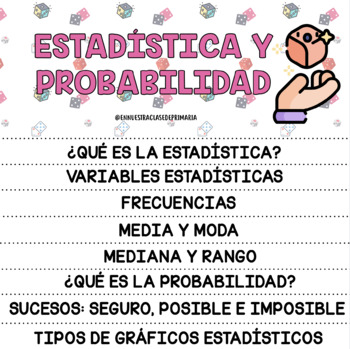
FLIPBOOK ESTADÍSTICA Y PROBABILIDAD
FLIPBOOK para trabajar los siguientes contenidos: ¿Qué es la estadística?Variables estadísticas.Frecuencias,Media y modaMediana y rango¿Qué es la probabilidad?Sucesos: seguro, posible e imposible. Tipos de gráficos.
Subjects:
Grades:
5th - 8th
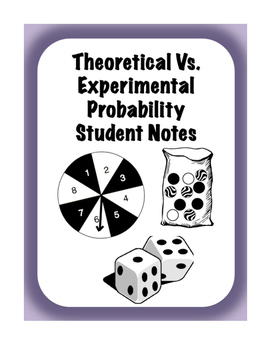
Theoretical vs Experimental Probability Interactive Scaffolded/Guided Notes
These notes provide a clear explanation of theoretical and experimental probability with examples involving spinners, die, and marbles. Students will also get extra practice converting their probabilities to decimals, fractions, and percents along with predicting the probability of an event happening.
There is also a flipped classroom video that goes along with these notes that can be accessed at-
https://youtu.be/FAHvmiYJA1A
Subjects:
Grades:
5th - 8th
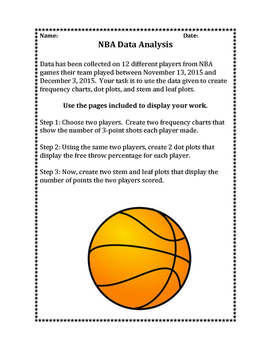
4th grade Data Analysis: Frequency Charts, Dot Plots, and Stem-and-Leaf Plots
This activity uses real NBA data to engage students in analyzing data. Students use data from 10 games of 12 players to create frequency charts, dot plots, and stem-and-leaf plots. Questions included allow students to reflect and analyze their work. Sure to grab your students' attention!
Subjects:
Grades:
4th
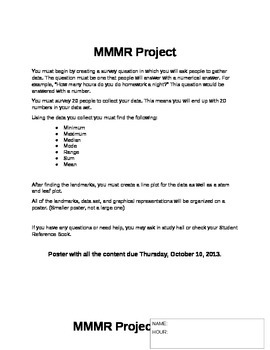
Mean, Median, Mode, and Range Project
This includes the instructions to give to the students as well as the rubric for grading the project. They must gather their own data and then complete the calculations using the data they collected.
Subjects:
Grades:
5th - 7th

Changing the Face of Math Education Book 2
Whether you are a teacher, a parent, a student, strong in math or weak in math, the material in this book will change the way you view and compute math in the future. Be ready to be amazed and intrigued as you go through the book by all the information you probably were never exposed to in your math education. This book will answer many questions you may have had in the past while giving you a much stronger conceptual understanding of math. This book will expose you to many different problem-sol
Subjects:
Grades:
4th - 12th
Types:
Find the Error - Data and Graphs with Central Tendency and Variation
This is an activity that I created for my students to find the mistake when a student has answered questions from graphs about measures of center and variation incorrectly. I used common errors to help them see the mistakes commonly made. All of my products are common core aligned.I had the students work alone to solve the problems first, and then share with their groups. If there was any discrepancy, they looked in the answer folder on their tables to see the correct answer. I rotated around
Subjects:
Grades:
5th - 7th
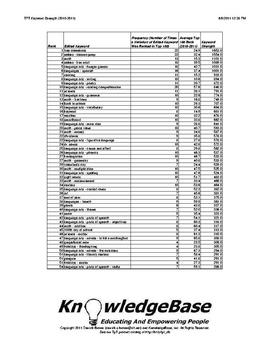
TPT KeyWord Strength Index (2010-2011) - Downloadable Spreadsheet!
What are the strongest keywords on TpT?
1. free downloads
2. Deanna Jump
3. math
Neither #1 nor #2 are surprises, but #3 (math) was certainly a surprise to me!
This report analyzes TpT's 2010-2011 keywords using a measure called "keyword strength".
The measure is based on a keyword's average rank, as well as the number of times it appeared in the 2010-2011 "Top 100" TpT search engine rankings.
This can be a valuable tool to help sellers understand TpT's marketplace supply and demand!
The P
Subjects:
Grades:
PreK - 12th, Higher Education, Adult Education, Staff

Data Representation Powerpoint
The presentation contains: 1) TALLY MARKS Learning Objectives. Definition of a tally mark. Uses of tally mark. How to count a tally mark. Tally Mark Chart. Construction of a tally mark table with an example. Application on real life problems on tally mark. Read and Interpret a tally mark table.The presentation contains: 2) FREQUENCY DISTRIBUTION TABLEDefinition of a Frequency Distribution Table. Types of Frequency Distribution Table: a) Discrete Frequency Distribution Table (Ungrouped).b) C
Subjects:
Grades:
1st - 10th, Higher Education, Staff
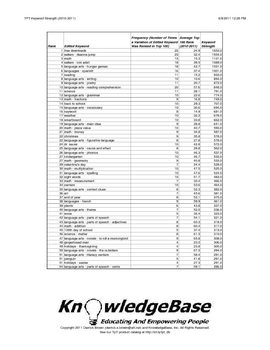
TPT KeyWord Strength Index (2010-2011) - Downloadable PDF!
What are the strongest keywords on TpT?
1. free downloads
2. Deanna Jump
3. math
Neither #1 nor #2 are surprises, but #3 (math) was certainly a surprise to me!
This report analyzes TpT's 2010-2011 keywords using a measure called "keyword strength".
The measure is based on a keyword's average rank, as well as the number of times it appeared in the 2010-2011 "Top 100" TpT search engine rankings.
This can be a valuable tool to help sellers understand TpT's marketplace supply and demand!
The P
Subjects:
Grades:
PreK - 12th, Higher Education, Adult Education, Staff
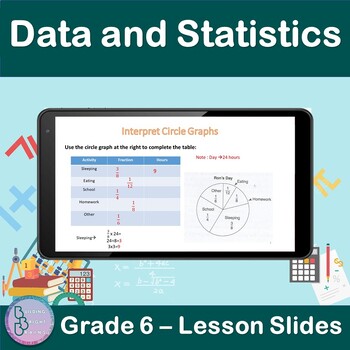
Data and Statistics | 6th Grade PowerPoint Lesson Slides | Circle Graphs
Are you teaching your students about Data and Statistics For 6th Grade? Plenty of examples and application exercises are included. You can also easily convert this to a Google Slides lesson by dragging it into your Google Drive.What is included?✦ 9 total slides for notes, examples and applications.✦ All steps are animated to allow the teacher to explain them gradually. At the end of the lesson, students will be able to✦ Interpret Circle Graphs.✦ Use a circle graph to complete s table.✦ Use a cir
Subjects:
Grades:
5th - 7th
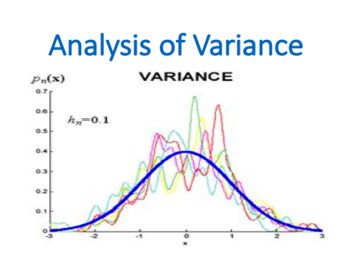
Analysis of Variance (ANOVA) (Statistics)
Analysis of Variance (ANOVA) is a lecture which is covered within the Statistic or Basic Business Statistic module by business and economics students.Analysis of variance, known by the acronym ANOVA, allows statistical comparison among samples taken from many populations. While ANOVA literally does analyze variation, the purpose of ANOVA is to reach conclusions about possible differences among the means of each group, analogous to the hypothesis tests of the previous chapter. Every ANOVA design
Subjects:
Grades:
5th - 12th, Higher Education, Adult Education, Staff
Types:
Also included in: Statistics Module Bundle

A Roadmap for Analyzing Data (Statistics)
A Roadmap for Analyzing Data is a lecture which is covered within the Statistic or Basic Business Statistic module by business and economics students. Choosing appropriate statistical methods for your data is the single most important task you face and is at the heart of “doing statistics.” But this selection process is also the single most difficult thing you do when applying statistics! How, then, can you ensure that you have made an appropriate choice? By asking a series of questions, you can
Subjects:
Grades:
5th - 12th, Higher Education, Adult Education, Staff
Also included in: Statistics Module Bundle

Cactus Themed Daily Schedule EDITABLE
Cactus Themed Daily ScheduleHave a daily timetable in your classroom that you can change each day and students know what is happening each day.In this pack you will get:*Schedule cards with clipart x5 to a page (35 different clipart)*Schedule cards without clipart x5 to a page (1 page included)*Schedule cards with clipart and clock x5 to a page (35 different clipart)*Schedule cards without clipart and clock x5 to a page (1 page included)*Heading "OUR SCHEDULE"*Heading "WHAT ARE WE DOING TODAY"
Subjects:
Grades:
PreK - 6th
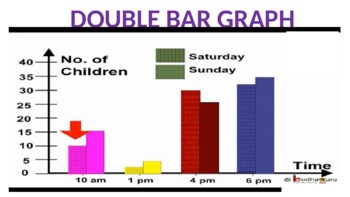
Double Bar Graph Powerpoint
The presentation contains:Learning Objectives.Definition of a double bar graph.Parts of a double bar graph.Difference between bar graph and double bar graph.Tips for construction of double bar graph.Steps to construct double bar graph with an example.To read and interpret the double bar graph.
Subjects:
Grades:
5th - 10th, Staff
Also included in: Data Representation Powerpoint
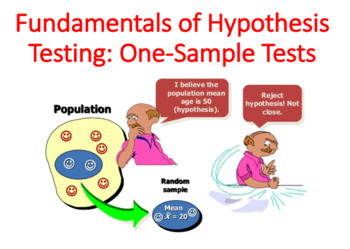
Fundamentals of Hypothesis Testing: One-Sample Tests
Fundamentals of Hypothesis Testing: One-Sample Tests is a lecture which is covered within the Statistic or Basic Business Statistic module by business and economics students. In this lecture, you will learn several applications of hypothesis testing. You will learn how to make inferences about a population parameter by analyzing differences between the results observed, the sample statistic, and many more. Learning objectives: The basic principles of hypothesis testingHow to use hypothesis testi
Subjects:
Grades:
5th - 12th, Higher Education, Adult Education, Staff
Types:
Also included in: Statistics Module Bundle

Pie Chart Powerpoint
The presentation contains:Learning Objectives.Definition of a Pie Chart.Tips for construction of pie chart.Steps to construct a pie chart with an example.Scaling and drawing a pie chart.Read and Interpret a pie chart.
Subjects:
Grades:
5th - 10th, Staff
Also included in: Data Representation Powerpoint
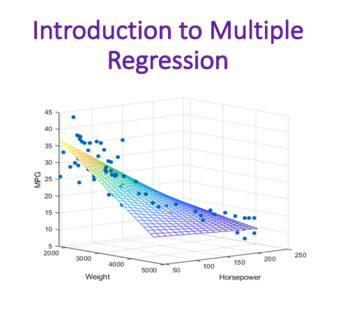
Introduction to Multiple Regression (Statistics)
Introduction to Multiple Regression is a lecture which is covered within the Statistic or Basic Business Statistic module by business and economics students.This lecture will introduce you to multiple regression models that use two or more independent variables to predict the value of a dependent variable. Learning objectives: · How to develop a multiple regression model· How to interpret the regression coefficients· How to determine which independent variables to include in the regression mode
Subjects:
Grades:
5th - 12th, Higher Education, Adult Education, Staff
Types:
Also included in: Statistics Module Bundle
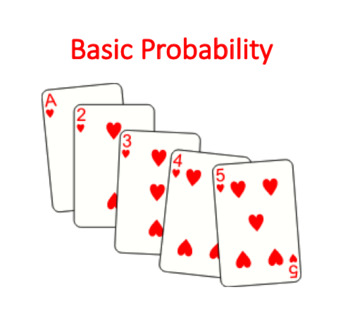
Basic Probability (Statistics)
Basic Probability is a lecture which is covered within the Statistic or Basic Business Statistic module by business and economics students.The principles of probability help bridge the worlds of descriptive statistics and inferentialstatistics. Probability principles are the foundation for the probability distribution, the concept of mathematical expectation, and the binomial, Poisson, and hypergeometric distributions, topics. In this lecture you learn to: Basic probability conceptsAbout conditi
Subjects:
Grades:
5th - 12th, Higher Education, Adult Education, Staff
Types:
Also included in: Statistics Module Bundle
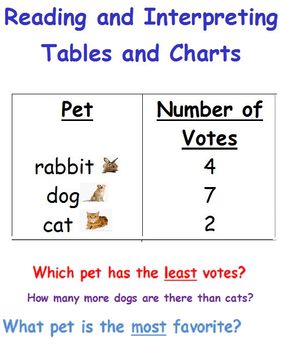
Reading a Table-Data and Statistics-First Grade
There are 4 different worksheets in which students can interpret the data of various tables. I hope they are of help to you! :)
Subjects:
Grades:
K - 3rd
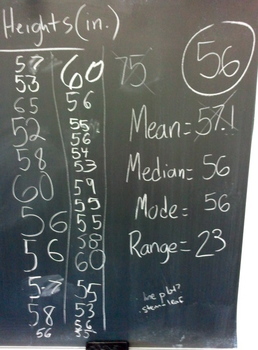
Introduction to Statistics (Focus on Mean, Median, Mode, & Range)
I use this PowerPoint presentation to introduce (or in some cases review) our statistics unit. It starts off with a warm-up where students measure each other to capture some class data on height. Then the slides go through key vocabulary words, like mean, median, mode, range, outlier, data set, and cluster. Each of those slides provides a definition that students can take notes from and an example. At the end of the presentation, students are encouraged to apply these statistical measures to
Subjects:
Grades:
3rd - 6th
CCSS:

42 Dice in 7 Colors | PNG Transparency | Graphics for Math, Games, Statistics
Create fun activities for your students with these digital die images. Each dice has a 3D effect giving them a more realistic look as opposed to a flat design. (Please view the thumbnails and preview PDF.)Each die is 1000 x 1000 px PNG image with transparency (transparent background). You can add your own effects like drop shadows in whatever graphic design software you're using.What you'll get in the zip folder:7 folders (one for each color set)each folder has 6 images (die 1 - 6)License/Terms
Grades:
1st - 3rd, Not Grade Specific

Line Graph Powerpoint
The presentation contains:Learning objectives.Definition of a line graph.Parts of a line graph.Tips for construction of line graph.Steps to construct line graph with an example.Reading and Interpreting a line graph.Advantage of line graph.
Subjects:
Grades:
5th - 10th, Staff
Also included in: Data Representation Powerpoint
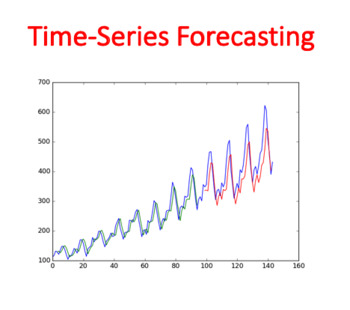
Time-Series Forecasting (Statistics)
Time-Series Forecasting is a lecture which is covered within the Statistic or Basic Business Statistic module by business and economics students. A time series is a set of numerical data collected over time. Due to differences in the features of data for various investments described in the Using Statistics scenario, you need to consider several different approaches for forecasting time-series data. This lecture begins with an introduction to the importance of business forecasting and a descript
Subjects:
Grades:
5th - 12th, Higher Education, Adult Education, Staff
Also included in: Statistics Module Bundle
Numerical Descriptive Measures (Statistics)
Numerical Descriptive Measures is a lecture which is covered within the Statistic or Basic Business Statistic module by business and economics students. Central tendency is the extent to which the values of a numerical variable group around a typical, or central, value. Variation measures the amount of dispersion, or scattering, away from a central value that the values of a numerical variable show. The shape of a variable is the pattern of the distribution of values from the lowest value to the
Subjects:
Grades:
5th - 12th, Higher Education, Adult Education, Staff
Types:
Also included in: Statistics Module Bundle
Showing 1-24 of 71 results


