8 results
High school statistics thematic unit plans $10 and up
O Level Statistics 4040 Lesson plans, Thematic Unit Plans Full Syllabus Latest
Unleash the Power of Statistics with Our Comprehensive Lesson Plan Bundle! Title: O Level Statistics 4040 - Complete Editable Lesson Plans BundleDiscover the world of statistics with our comprehensive lesson plan bundle. "O Level Statistics 4040 - Complete Editable Lesson Plans Bundle" equips you with a treasure trove of editable resources, ensuring a thorough understanding of statistics for both educators and students. Key Features:✨ Full Syllabus Coverage: Our bundle covers the entire O Leve
Subjects:
Grades:
6th - 12th, Adult Education, Staff
The Averages - Complete Unit of Work
In this unit, students will learn how they can use averages and range to represent data. They will start by learning the meaning of range, mode, median and mean, and how to use these measures with lists of data, before looking at finding the averages and range from frequency tables, for grouped data, from stem and leaf diagrams and choosing between different measures of average.
ABOUT THIS RESOURCE PACK:
This pack is designed to provide teachers with complete lesson plans and classroom resourc
Subjects:
Grades:
6th - 9th
Also included in: Complete Bundle - All units of work
Cumulative Frequency, Box Plots & Histograms - Complete Lesson
In this unit students will learn how to represent data graphically. They will start by drawing cumulative frequency tables and graphs, and then interpreting these graphs (including finding the median). They will then go on to look at quartiles and interquartile range (including from cumulative frequency graphs) and represent data using box plots. Students will then learn how to compare two or more distributions before moving on to draw and interpret histograms.
About this Resource Pack
This pac
Subjects:
Grades:
7th - 10th
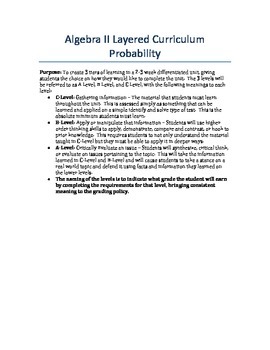
Probability Layered Unit
This is a 2-3 week differentiated unit on probability, giving students the choice on how they would like to complete the unit. The 3 levels will be referred to as A Level, B Level, and C Level, with the following meanings to each level:
• C-Level: Gathering information – The material that students must learn throughout the unit. This is assessed simply as something that can be learned and applied on a simple identify and solve type of test. This is the absolute minimum students must learn.
•
Subjects:
Grades:
9th - 12th
Probability - Complete Unit of Work
In this unit, students will learn how to calculate probabilities. They start by working out theoretical probabilities of single events, before looking at using experiments to estimate probabilities. They will look at finding probabilities of combinations of events by listing outcomes, by calculating probabilities of independent events, using tree diagrams and Venn diagrams to work out probabilities and will calculate conditional probabilities.
ABOUT THIS RESOURCE PACK:
This pack is designed to
Subjects:
Grades:
7th - 10th
Also included in: Complete Bundle - All units of work
Representing & Interpreting Data - Complete Unit of Work
In this unit, students will look at how they can use charts and graphs to represent data in maths. They will look at the following graphs –composite and comparative bar charts, pie charts, line graphs (including for time series data), histograms with equal class intervals and frequency polygons.
ABOUT THIS RESOURCE PACK:
This pack is designed to provide teachers with complete lesson plans and classroom resources to teach excellent lessons. It is designed to both teach the mathematical content
Subjects:
Grades:
7th - 10th
Also included in: Complete Bundle - All units of work
Tables - Complete Unit of Work
In this unit, students will learn how to use tables in data handling. They will begin by looking at collecting data and designing data collection sheets for both discrete and continuous data, before looking at extracting information from tables and lists and creating tables of their own. Students will then look at the particular cases of tables for time series data, timetables, two way tables and frequency tables.
ABOUT THIS RESOURCE PACK:
This pack is designed to provide teachers with complet
Subjects:
Grades:
6th - 9th
Also included in: Complete Bundle - All units of work
Averages & Range - Complete Unit of Work
In this unit, students will learn how they can use averages and range to represent data. They will start by organising data into two way tables, frequency tables (including grouped frequency tables) and stem and leaf diagrams. They will then look at using these tables (and lists of numbers) to calculate range, mode, median and mean, understanding the uses and value of each type of average.
ABOUT THIS RESOURCE PACK:
This pack is designed to provide teachers with complete lesson plans and classr
Subjects:
Grades:
7th - 10th
Also included in: Complete Bundle - All units of work
Showing 1-8 of 8 results


