638 results
Study skills graphing outlines
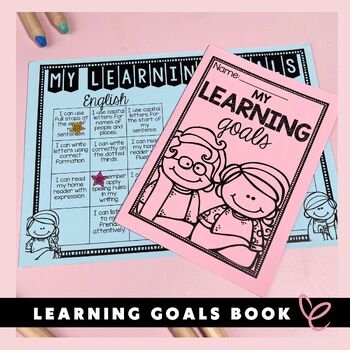
Goal Book | Student Goal Setting
Goal Book | Student Goal SettingIntroducing the Goal Book - a simple and effective way to track and manage student goals throughout the year! With this comprehensive goal book, you can easily set goals for English, Mathematics, or any other subject, and customize them to reflect the Curriculum and the year level of your students.The Goal Book is designed to cater to different abilities within your class, with goals that can be set for students working below, at, and above Curriculum benchmarks.
Subjects:
Grades:
K - 7th
Types:
Linear Functions
Linear Functions
This is a great one page cheat sheet on the following three forms of a line...
Intercept Form, Point Slope Form, and Standard Form
Also included, is how to find intercepts and slopes.
Two sheets are included, one in color and the other in black and white.
Easily made into a tri-foldable.
Connect with Me
Follow my WebsiteMath to the Core on FacebookMath to the Core BlogMath to the Core on PinterestMath to the Core on TwitterMath to the Core on Instagram
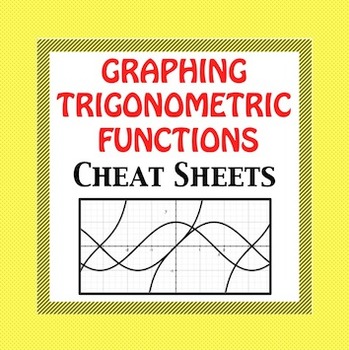
Trig Functions - Graphing Cheat Sheet
Trig Functions - Graphing Cheat Sheet*****UPDATED with different formula versions******Text books make graphing trig functions so complicated. I have simplified the process so that even below average students can follow the process easily and graph trig functions without frustration. I have passed these trig notes out to absent students and NO explanation was necessary! Trig graph paper also is included.The different versions use different formulas and variables.y = asin(bx−c)+d y = asi
Subjects:
Grades:
10th - 12th, Higher Education, Adult Education
Types:
Go Math Grade 3 Chapter 2 Slides
Powerpoint/Slides based on Go Math, Grade 3, Chapter 2.
ALL LESSONS (2.1-2.7)
During Chapter 2, students will learn about data- how it is organize and how to create bar graphs, picture graphs, and line graphs.
-Lesson topic
-Problem of the Day
-Common Core standards
-I Can statement (with visuals)
-Fluency Practice/ Math Drills
-Vocabulary
-Easy to follow lesson through the workshop model (I do, We Do, You Do)
-Turn and Talks
-An option for reteach
-Problem Solving
-Share/Reflection
-Ex
Subjects:
Grades:
3rd
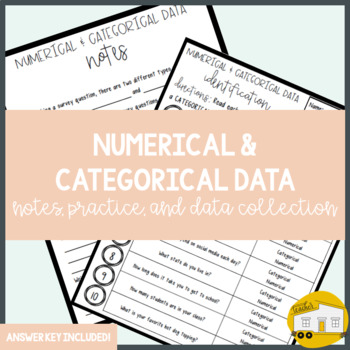
Numerical & Categorical Data - Notes, Practice, and Application!
Help students understand the difference between Numerical and Categorical Data as you discuss their explicit meanings through notes. Reinforce the concepts and make it real-life for students as they create their own survey questions and survey their classmates! ✨ print-and-go...no prep required!✨ answer keys included!✨ engaging activities!This resource can be used to:✔️ introduce the concept for the first time, or✔️ review this topic in a fun way!_______________________________________Reviews fr
Subjects:
Grades:
3rd - 6th
Types:
Praxis 5623 PLT Grades 5-9 Study Guide
This comprehensive, 52-page study guide is the perfect resource to study for the Principles of Learning and Teaching Praxis! I created this when I studied for the Praxis and got an almost perfect score of 195 out of 200 on my first try. There are very few study materials available for the PLT, so this is a quality, low-cost resource for teachers in their certification process. This study guide follows the Praxis Study Companion section by section and thoroughly explains every single topic covere
Grades:
5th - 9th, Higher Education, Adult Education, Staff
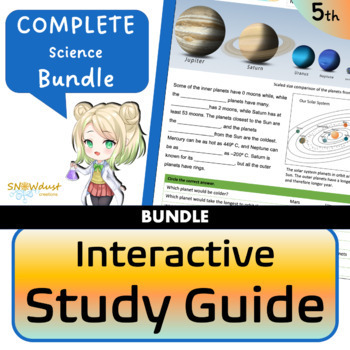
Florida 5th Grade Interactive Study Guide - Complete Science Bundle
Print and go interactive study guide covers your Florida science standards for 5th grade. This resources also works well for ELLs and struggling science students for notetaking purposes. Cloze passages and interactive visuals help students review material in preparation for unit tests of the science FSSA. This Resource is Great for: Test ReviewAt Home Learning, HomeworkSkill Practice or ReviewEnglish Language LearnersStruggling Science Students Each Activity Includes:1 or 2 student pages (graysc
Subjects:
Grades:
4th - 6th
Types:
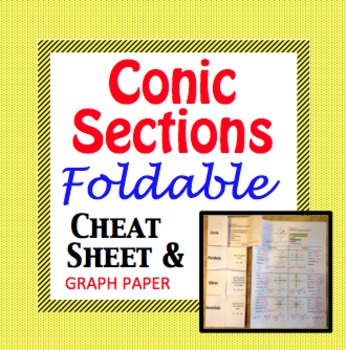
Conic Sections Cheat Sheet - Foldable for Circle, Parabola, Ellipse, Hyperbola
Conic Sections Cheat Sheet - Foldable for Circle, Parabola, Ellipse, and Hyperbola. Graph paper included!
*** UPDATED *** Now with highlighted a,b, and c lengths AND a version with parametric equations.
Create a foldable or just pass out the Conic cheat sheet, the choice is yours.
Please view my free preview.
I also use the unfilled conic foldable as a quiz or pretest warmup.
This is a comprehensive guide to the 4 conic sections (circle, parabola, ellipse, and hyperbola).
This file inc
Subjects:
Grades:
9th - 12th, Higher Education, Adult Education
Types:
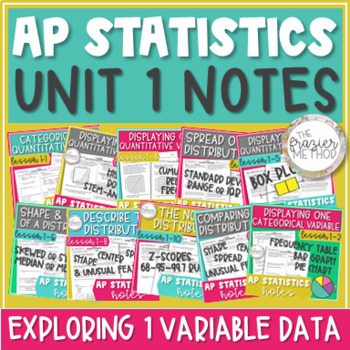
AP Statistics Notes Unit 1 Histogram, Box Plot, Skew, Mean, Normal Distribution
Use these AP® Statistics notes to teach UNIT 1 – EXPLORING ONE-VARIABLE DATA. Histograms, box plots, dot plots, stem-and-leaf plots, bar graphs, outliers, 5-number summary, z-scores, Normal Distribution / Normal Model, and describing a distribution's shape, center, & spread! Skewed or symmetric, median or mean, standard deviation or interquartile range... You can also use these notes for AP® Stats exam review! Aligns with the updated 2019-2020 objectives and standards of Unit 1: Exploring On
Subjects:
Grades:
10th - 12th
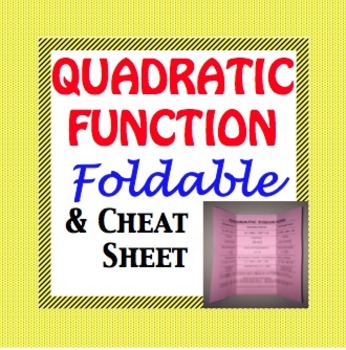
Quadratic Equation
Quadratic Equation
Quadratic Function Cheat Sheet - Foldable for the Equation of a Parabola
UPDATED - Now with a fill in the blank version. Perfect for note taking or a quiz.
This is a great one page cheat sheet on the following three forms of a parabola...
Intercept Form, Vertex Form, and Standard Forms.
Details regarding maximum, minimum and intercepts included.
Easily made into a tri-foldable.
Products you may also like...
Quadratic/Parabola Function Graph Trasformation - Card Ma
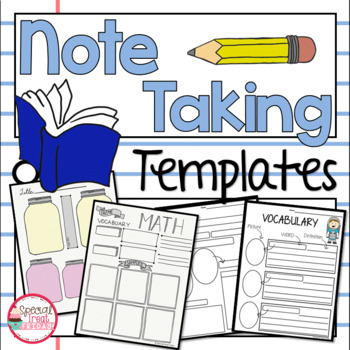
Note Taking Templates Elementary
Are you needing Note Taking Templates or pre-planned note sheets for your students? Do your students need help taking notes? These templates help elementary students in each subject area take notes, they can review these notes for studying, use them in research, refer back for an assignment or use them to help them recall. It is great practice for the higher gradesDo you have state testing coming up? These note sheets are perfect for your students to use in practicing for their test and to use d
Subjects:
Grades:
2nd - 4th
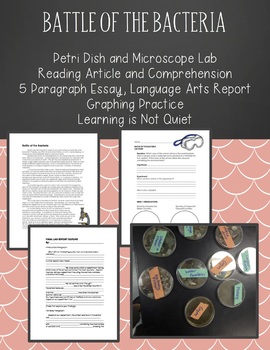
Battle of the Bacteria Cells Petri Dishes (Article, experiment, report)
Battle of the Bacteria Video / Lesson Plan Explained: https://www.youtube.com/watch?v=OAXqaKTLoRcWhether you teach upper elementary or middle school, it can be difficult to fit all of the subjects in a given day. With this activity, it makes it simple to teach math, writing, reading, health, and of course science together with one experiment. (I have done this activity as a 5th grade and 7th grade teacher).In this activity, students go throughout the school and collect samples of places that t
Subjects:
Grades:
5th - 7th
Types:
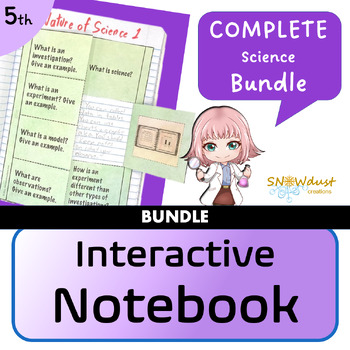
Full Bundle – Florida Interactive Science Notebook
Interactive notebook activities made just for Florida Science! These student-centered science notebook lessons cover testable standards for grade 5. These outlines allow kids to make sense of the science in their own way by taking notes on standards aligned prompts. Questions based on the Next Generation Sunshine State Science StandardsOpen-response allows students to process the content in their own way Vocabulary game keeps kids engaged while note-takingReady-made images lets students use vis
Subjects:
Grades:
4th - 6th
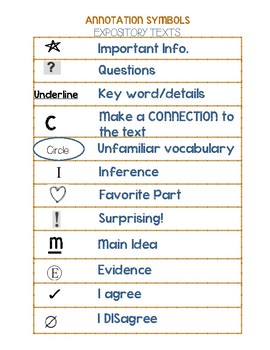
Annotation Symbols and Quiz
1) Poster: 12 essential annotation symbols can be used in any content and any level
2) Quizzes: 2 to a page (2 identical versions)--I'm all about saving paper and you can get 4 to a sheet with some fancy printing.
3) Student Bookmark: students can glue this into a journal or you could print it on card stock and they can hole punch it to keep at the front of their binder.
Our entire High School used these symbols last year--it made it much easier for students to see the validity of the symbols w
Subjects:
Grades:
Not Grade Specific
Types:
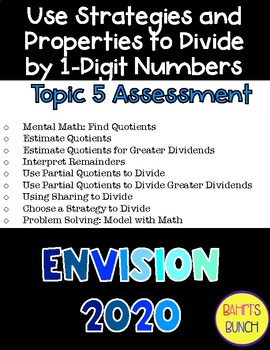
enVision 2020 Grade 4 - Topic 5 Assessment - Dividing by 1-Digit Numbers
This assessment was created for the enVision 2020 math curriculum (Grade 4). It covers Topic 5 over Using Strategies and Properties to Divide by 1-Digit Numbers. It can be used as an alternative assessment to the one provided through enVision, OR it can be used as a study guide to help prepare for the assessment.Topic 5 Concepts:- Mental Math: Find Quotients- Estimate Quotients- Estimate Quotients for Greater Dividends- Interpret Remainders- Use Partial Quotients to Divide- Using Partial Quotien
Subjects:
Grades:
4th
Types:
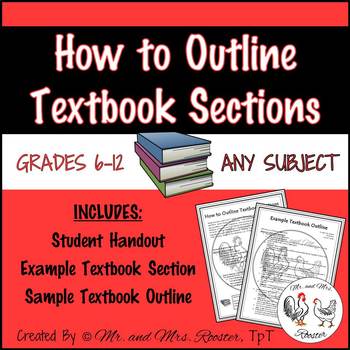
How to Outline Textbook Sections
Looking for an easy way to help students learn how to outline a textbook section? This product will help you and your students!
Textbooks are a useful tool in nearly every class as they provide important information, definitions, good visuals, and examples. While textbooks can be very useful, they can also be difficult to read, understand, and comprehend. My first year teaching Freshman students, I found that many of them were at elementary reading levels, which made reading a high school text
Subjects:
Grades:
6th - 12th
AP Statistics Notes Box Plot / Boxplot, Quartile, IQR, Outlier, 5 Number Summary
AP Stats notes to teach or review BOXPLOTS / BOX PLOTS / BOX-AND-WHISKER PLOTS! Define & calculate the median, interquartile range, 5-Number Summary, minimum, maximum, first quartile (Q1), third quartile (Q3), and percentiles for a set of data. Also, determine which data values are outliers based on the upper fence and lower fence of a boxplot. Students will graph box plots by hand given just a few of the data values and with step-by-step TI-84 Plus CE Calculator directions given the full li
Subjects:
Grades:
9th - 12th
AP Statistics Notes Normal Distribution Z-Scores Empirical Rule Normal Model
Great AP Stats notes on the NORMAL DISTRIBUTION & Z-SCORES! Students will use the Normal Model and Empirical Rule (68-95-99.7% Rule) to find a data value, calculate z-scores, and find the area under the Normal curve using both the z-score formula and TI-84 Plus CE calculator functions. Students will also interpret z-scores in context, write the Normal Model notation N(µ, σ), and determine whether a data value can be considered “unusual.” Perfect for AP Stats Exam review prep! Aligns with AP
Subjects:
Grades:
9th - 12th
Algebra 1 Curriculum Full Year (Editable) Guided Notes | Math Lion
This is a great bundle that covers concepts for a full year Algebra 1 course! 76 lessons are included!All documents are EDITABLE!Included:- Overview of the common core alignment- Guided notes for 76 lessons (173 Pages)Each lesson contains a learning scale, warm up (do-now or bell ringer), key concepts, vocabulary, and examples for students to follow with their guided notes. Each lesson is aligned with the common core state standards. Download the preview to see all the lessons that are available
End Behavior of Polynomials Cheat Sheet or Foldable
End Behavior of Polynomials Cheat Sheet or Foldable.
Create a foldable or just pass out the End Behavior cheat sheet, the choice is yours.
I have found that this is the BEST way to teach end behavior.
Your students will understand this concept in 5 minutes guaranteed!!! If they do not, then please let me know!
5 pages included.
Front of End Behavior Foldable
Inside of End Behavior Foldable
One page Cheat Sheet Fillable
One page Cheat Sheet Filled
One page Cheat Sheet Filled (slight variati
Subjects:
Grades:
9th - 12th, Higher Education, Adult Education
Types:
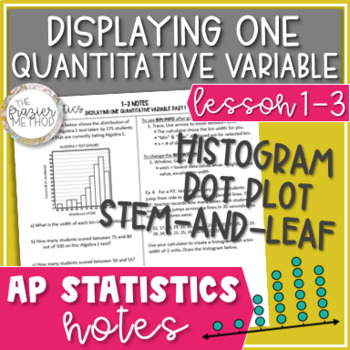
AP Statistics Notes Histograms, Dot Plots, & Stem-and-Leaf Plots - Data Displays
AP Stats notes to teach or review graphing and reading DOT PLOTS, STEM-AND-LEAF PLOTS, & HISTOGRAMS! Students will graph histograms using a TI-84 Plus CE Calculator and graph a dot plot and stem-and-leaf plot by hand. Practice problems and examples include answering questions about a set of data values displayed in a histogram. Great for AP Stats Exam prep! Aligns with AP College Board's updated 2019-2020 objectives and standards for AP Statistics Unit 1: Exploring One-Variable Data. WHAT’S
Subjects:
Grades:
9th - 12th
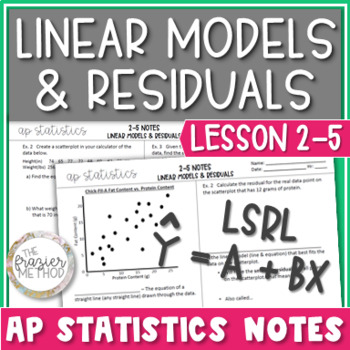
Linear Models & Residuals / Regression Line of Best Fit - AP Statistics Notes
AP Stats Notes on LINEAR MODELS & RESIDUALS. Write the equation of a linear regression model from a list of data values and use step-by-step TI-84 Plus CE Calculator directions to find the equation of the Line of Best Fit / Least Squares Regression Line (LSRL). With formulas and the regression equation, calculate residuals (e), predicated values (y-hat), y-intercept, & slope of the linear model. Templates for “interpret in context” questions are also included! Great AP Stats Exam prep! A
Subjects:
Grades:
10th - 12th

Linear Equation Solutions Cheat Sheet - Foldable
Linear Equation Solutions Cheat Sheet - Foldable
Intersecting, parallel, and identical lines are featured with clear examples.
One Solution, No solution, and Infinitely Many Solutions are shown via graph, linear equations, and worked out solutions to their system of equations.
Discussion of slope and y-intercept are included for all three solution types.
This is a great one page cheat sheet which can easily made into a tri-foldable.
All of my students find it to be a great tool. I a
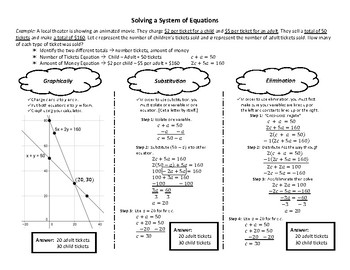
Solving a System of Linear Equations Graphic Organizer
This is a graphic organizer that shows the three ways to solve a system of linear equations (graphically, by substitution, by elimination). The purpose of this organizer is not only to show the steps for solving, but to show students that no matter which method you choose, you will arrive with the same answer.
Subjects:
Grades:
7th - 12th
CCSS:
Showing 1-24 of 638 results


