833 results
Not grade specific statistics resources for staff
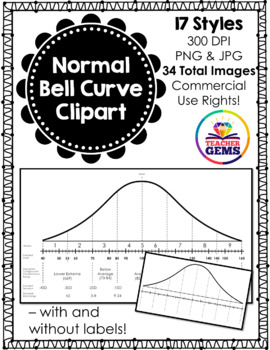
Normal Bell Curve (Normal Distribution) Clipart
Normal Bell Curve (Normal Distribution) Clipart: This Normal Bell Curve (Normal Distribution) clipart set includes 17 distinct styles (6 blank styles and 11 styles with scores) that come in both PNG (transparent) and JPEG (white background) for a total of 34 images. All image files are 300dpi. Commercial use is allowed with proper credit given (see my Terms of Use in the download – or read prior here). Below is a breakdown of all the images included in this product.Normal Bell Curve (NBC) Table
Subjects:
Grades:
Not Grade Specific
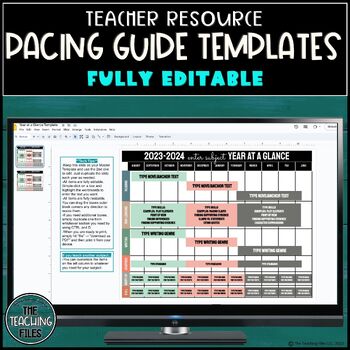
Pacing Guide and Year At A Glance Editable Templates Full Year
These Pacing Guide and Year At A Glance Editable Templates are core to mapping out your school year. Each template is fully editable and customizable for any subject. About This Product:-Google format-2 templates:Daily/Weekly Pacing Guide Year At A Glance -Fully editable-The daily/weekly pacing guide is dated for you from August 2023-July 2024, however, you can adapt dates if needed. -When you download the product, it will AUTOMATICALLY make a copy for you in your Google Drive. All you must do i
Subjects:
Grades:
Not Grade Specific
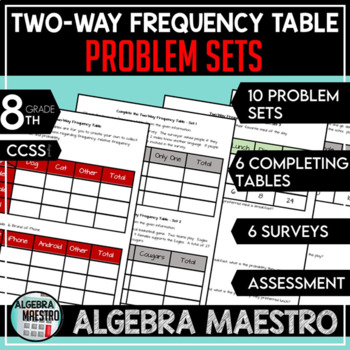
Two-Way Frequency Table Problem Sets
The Two-Way Frequency Table (or two way tables) is designed to give students a lot of practice so they can fully understand and master two-way frequency tables. Included: 10 problem sets (40 total problems), 6 completing tables problem, 6 surveys to collect & analyze data, an assessment, and answer keys to every activity. These are great activities to get students to understand statistics and relationships including ratios, fractions, probability, and develop critical thinking and reasoni
Subjects:
Grades:
6th - 12th, Higher Education, Adult Education, Staff
Types:
CCSS:
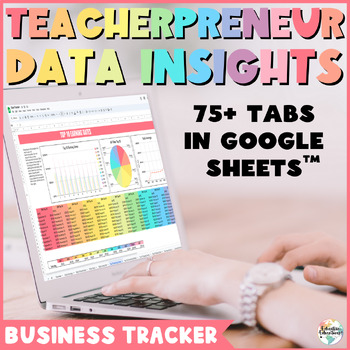
Teacherpreneur Data Insights - TPT Seller Business Tracker Analysis Spreadsheets
Welcome to Teacherpreneur Data Insights – a business data tracker designed to elevate your teacher seller journey. Gain actionable insights, track trends, and optimize your strategies with this comprehensive tool. In a world where data is powerful, this guidebook and Google Sheets combo empowers you to navigate your TPT store effectively. Seamlessly analyze your metrics, make informed decisions, and propel your store to new heights. Utilize this powerful tool to identify your best-selling produc
Subjects:
Grades:
Not Grade Specific
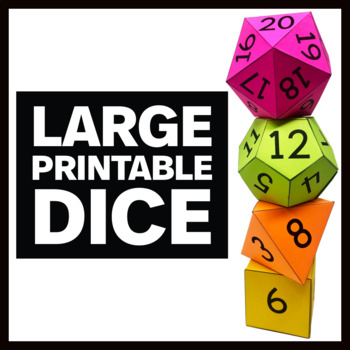
Printable Dice Templates - Blank Die Templates - 6, 8, 12, and 20 sided
This is a set of four printable dice templates. Each template comes with a numbered and a blank version. 6 sided 8 sided 12 sided 20 sided This resource is easy to use! Print out the 3D shape you want to assemble, cut out the net of the polyhedron, fold on the lines, and glue the flaps to the corresponding side.You can also use the blank shapes in your geometry or math class if you want to construct a 3D cube, octahedron, dodecahedron, or icosahedron.
Subjects:
Grades:
Not Grade Specific
Types:
BACK TO SCHOOL STEM ACTIVITY: Spaghetti Marshmallow Challenge
Don't miss out on this wonderful opportunity for your students to work collaboratively, problem-solve, show creativity and use their math skills! This Spaghetti Marshmallow Challenge cost me less than $2.00 for all supplies but delivers such a big bang for the buck! Fun for students K-12 (they say that the kindergarteners actually build the highest!). Enjoy!
Subjects:
Grades:
PreK - 12th, Higher Education, Adult Education, Staff
Types:
FTCE General Knowledge Exam Test Prep Math
This is an original and growing; FTCE General Knowledge Exam Math Test Prep Pack. Word problems; Distance, slope, Statistics - Probability Percentages - Unit GeometryScale and ratioAdditional percentages, probability, scale and ratio material added. Here’s what teachers just like you are saying about this resource:⭐️⭐️⭐️⭐️⭐️ Kristie N. says, "I found this very helpful! Thank you...." ⭐️⭐️⭐️⭐️⭐️Recebba G. says, "Thank you for putting this together!" ⭐️⭐️⭐️⭐️⭐️Halley U. says, "There are GK math t
Subjects:
Grades:
Not Grade Specific
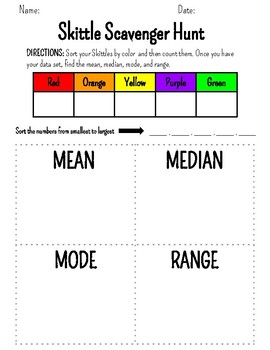
Mean, Median, Mode, and Range Skittle Activity
Have students practice mean, median, mode, and range using Skittles!
Subjects:
Grades:
Not Grade Specific
Types:
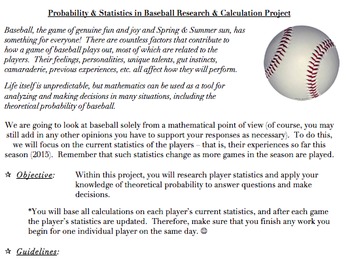
Probability & Statistics in Baseball Project (Common Core Aligned, AND FUN!)
The problems and activities within this document are designed to assist students in achieving the following standards: 6.SP.B.5, 7.SP.C, HSS.CP.A.2, HSS.CP.A.3, HSS.CP.B.7, HSS.CP.B.9, as well as the standards for mathematics practice and the literacy standards. They are also designed to help the teacher assess the students’ abilities when it comes to working with the ideas within the standards.This document contains the following:A project designed to allow students to investigate theoretical
Subjects:
Grades:
5th - 12th, Higher Education, Adult Education, Staff
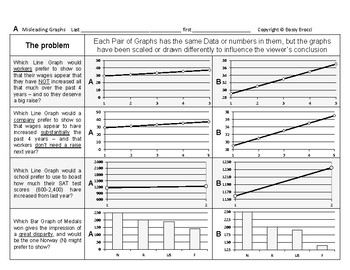
Stats&Data 14: Misleading & Misinterpreting Data Graphs Charts Statistics
This is an excerpt from my popular line ofBossy Brocci Math & Big Science workbooks on Amazon.ANSWER KEY included=======================Students will:1) Analyze 20 different Graphs or Data Displays2) Draw Conclusions & Answer questions about theaccuracy, fairness, limitations & legitimacy of those Graphs3) Answer 16 Multiple-choice questionsbased on their Calculations & Observations4) Be compelled to show their work in a neat & orderly format5) Be trained to methodically &
Subjects:
Grades:
Not Grade Specific
Types:

AP Psych / AP Psychology - Unit 1: Scientific Foundations - Activity Pack!
Includes the wildly popular ESCAPE ROOM Activity, as well as analyzes and practices nearly all standards regarding Unit 1: Scientific Foundations of Psychology, including 1.B, 1.C, 1.E, 1.F, 1.G, 1.H, 1.I, 1.J, 1.L, 1.M, 1.N, and 1.O!In class or as homework, students must assess, analyze, graph, calculate, and interpret data regarding psychological studies. All questions are original, and modeled after the College Board format and difficulty. After learning about the topics in class, these are
Subjects:
Grades:
8th - 12th, Higher Education, Adult Education, Staff
Types:
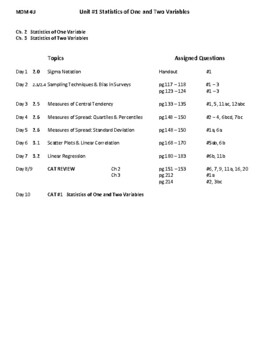
MDM4U Data Management Grade 12 ONTARIO CURRICULUM MHR textbook Entire course
MDM4U Grade 12 Data Management Ontario Curriculum MHRGreat for the classroom or online learning.This package includes over 125 organized and labeled files (using folders for units) created by a teacher with over 20 years of experience. This package would be great for any teacher who needs a specific outline of the calculus part of the course and does not want to do any lesson planning. Would also be great for any student who wants to study to the in depth completed notes.This course was develope
Subjects:
Grades:
12th, Staff
Types:
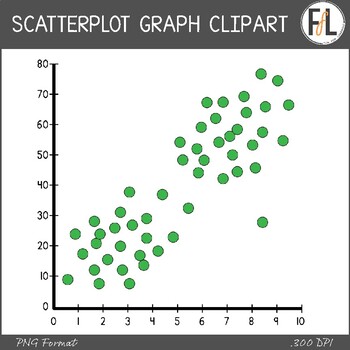
Statistics Clipart - SCATTERPLOT GRAPHS
Need some clipart for your secondary grades statistics product? This graphics resource features 7 different scatterplot graphs in a variety of different options that are perfect for making worksheets, interactive notebook elements, interactive whiteboard activities and more! The graphs all come in the following options:2) labeled or unlabeled 3) color, grayscale, or blacklineThe following distribution types are represented by at least one of the graphs:- positive correlation- negative correlat
Subjects:
Grades:
Not Grade Specific
Also included in: Statistics Clipart - Graphs, Secondary Grades - BUNDLE
Stats&Data Bundle C: Data Displays Measures of Central Tendency & Variation
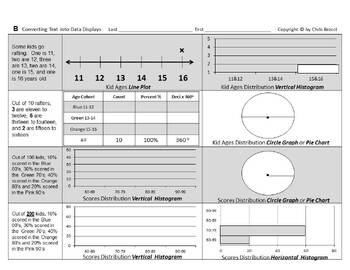
From the Author of Bossy BrocciMath & Big Science workbooks on Amazon,this Bundle of Data Displays,Measures of Central Tendency(Mean, Median, Mode & Range);and Measures of Variation(Quartiles, Interquartile Range, Outliers & Box Whisker plots)contains:11 Lessons32 Worksheets832 Problems & Tasks- and Assessment up the a$$=======================Answer KEYS included=======================Coverage Specifics:#1 Identify & Select Common Typesof Data DisplaysStudents will:1) Identi
Subjects:
Grades:
Not Grade Specific
Types:
Stats&Data Slides Bundle C: Data Displays Measures of Central Tendency Variation
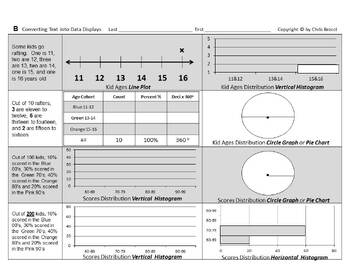
From the Author of Bossy BrocciMath & Big Science workbooks on Amazon,comes student fillable editable interactiveGoogle Slides™ for Google Classroom™ Students can insert/overlay text & graphics[textboxes, shapes, lines, arrows, colors etc.]onto the G-Slide image backgroundorConvert to PDF, then make it interactive onlineby using various third-party Ed. websitesorPrint it for paper worksheets=======================This Bundle of Data Displays,Measures of Central Tendency(Mean, Median, M
Subjects:
Grades:
Not Grade Specific
Types:
Statistics for Business and Economics 14th Edition By James, George TEST BANK
TEST BANK for Statistics for Business and Economics 14th Edition James T. McClave; P. George Benson; Terry T SincichTABLE OF CONTENTSCHAPTER 1. Statistics, Data, and Statistical Thinking CHAPTER 2. Methods for Describing Sets of DataCHAPTER 3. ProbabilityCHAPTER 4. Random Variables and Probability DistributionsCHAPTER 5. Sampling Distributions CHAPTER 6. Inferences Based on a Single Sample: Estimation with Confidence IntervalsCHAPTER 7. Inferences Based on a Single Sample: Tests of HypothesesCHA
Subjects:
Grades:
Higher Education, Adult Education, Staff
Essentials of Statistics for Business and Economics, 10th Ed Jeffrey SOLUTIONS
SOLUTIONS MANUAL Essentials of Statistics for Business and Economics, 10th Edition Jeffrey D. Camm, James J. Cochran, Michael J. Fry, Jeffrey W. Ohlmann, David R. Anderson, Dennis J. Sweeney, Thomas A. WilliamsTABLE OF CONTENTS1. Data and Statistics.2. Descriptive Statistics: Tabular and Graphical Displays.3. Descriptive Statistics: Numerical Measures.4. Introduction to Probability.5. Discrete Probability Distributions.6. Continuous Probability Distributions.7. Sampling and Sampling Distribution
Subjects:
Grades:
Higher Education, Adult Education, Staff
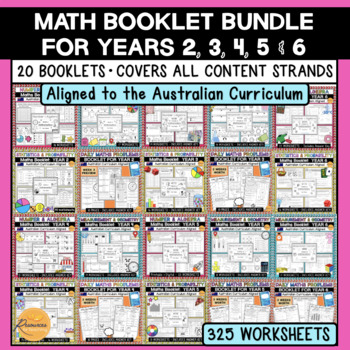
Math Worksheets and Booklets Bundle - Years 2, 3, 4, 5 & 6 Australian Curriculum
This ultimate math worksheets and booklets BUNDLE DEAL includes 325 maths worksheets (20 booklets) aligned with the Australian Curriculum and covers ALL of the syllabus outcomes and content for Year 2, 3, 4, 5 and 6 students! A MASSIVE time-saver for teachers, with a plethora of worksheets to select for classwork, revision, homework or assessment tasks throughout the school year. Excellent for classroom teachers and substitute teachers who require quick, no-prep worksheets! Please read the descr
Subjects:
Grades:
Not Grade Specific
Types:
Statistics for Business and Economics 14th Edition James George SOLUTIONS MANUAL
SOLUTIONS MANUAL for Statistics for Business and Economics 14th Edition James T. McClave; P. George Benson; Terry T SincichTABLE OF CONTENTSCHAPTER 1. Statistics, Data, and Statistical Thinking CHAPTER 2. Methods for Describing Sets of DataCHAPTER 3. ProbabilityCHAPTER 4. Random Variables and Probability DistributionsCHAPTER 5. Sampling Distributions CHAPTER 6. Inferences Based on a Single Sample: Estimation with Confidence IntervalsCHAPTER 7. Inferences Based on a Single Sample: Tests of Hypoth
Subjects:
Grades:
Higher Education, Adult Education, Staff
Math Color by Number - Box Plot Fun
I'm making it my mission to take some of the most irrelevant, abstract concepts for students, and turning them into FUN color-by-number activities. Why should these fun coloring activities stop once kids leave elementary school? Watch your students actually care about their answers as they quietly work to color each picture correctly. You can assess their progress quickly, just by glancing to see if they colored their pictures correctly.
The directions for students are as follows: Complete t
Subjects:
Grades:
5th - 8th, Staff
Types:
Basic Statistics for Business And Economics 7th Edition By Douglas TEST BANK
Test Bank For Basic Statistics for Business And Economics 7th Edition By Douglas A. Lind, William G. Marchal, Samuel A. Wathen, Carol Ann Waite, Kevin MurphyTABLE OF CONTENTSCHAPTER 1: What Is Statistics? CHAPTER 2: Describing Data: Frequency Tables, Frequency Distributions and Graphic Presentation CHAPTER 3: Describing Data: Numerical Measures CHAPTER 4: A Survey of Probability Concepts CHAPTER 5: Discrete Probability Distributions CHAPTER 6: Continuous Probability Distributions CHAPTER 7: Samp
Subjects:
Grades:
Higher Education, Adult Education, Staff
Basic Business Statistics: Concepts and Applications 11th Ed Berenson TEST BANK
TEST BANK for Basic Business Statistics: Concepts and Applications 11th Edition by Mark Berenson, David Levine and Timothy Krehbiel. TABLE OF CONTENTSChapter 1: Introduction and Data Collection Chapter 2: Presenting Data in Tables and Charts Chapter 3: Numerical Descriptive Measures Chapter 4: Basic Probability Chapter 5: Some Important Discrete Probability Distributions Chapter 6: The Normal Distribution and Other Continuous Distributions Chapter 7: Sampling and Sampling Distributions Chapter 8
Subjects:
Grades:
Higher Education, Adult Education, Staff
Applied Statistics in Business and Economics 7th Edition David Doane TEST BANK
TEST BANK for Applied Statistics in Business and Economics 7th Edition by David Doane & Lori Seward.TABLE OF CONTENTS:Chapter 1: Overview of Statistics Chapter 2: Data Collection Chapter 3: Describing Data Visually Chapter 4: Descriptive Statistics Chapter 5: Probability Chapter 6: Discrete Probability Distributions Chapter 7: Continuous Probability Distributions Chapter 8: Sampling Distributions and Estimation Chapter 9: One-Sample Hypothesis Tests Chapter 10: Two-Sample Hypothesis Tests Ch
Subjects:
Grades:
Higher Education, Adult Education, Staff
Data Literacy in STEM & Digital Technologies | Numerical, Categorical & Digital
Enhance your student's understanding of DATA LITERACY and DIGITAL LITERACY What is Data? Why it's important? How do numerical, categorical, and digital data fit within STEM and DIGITAL TECHNOLOGIES?Well, look no further... This bundle contains everything you need to teach the essentials of DATA LITERACY with absolutely NO PREP REQUIRED.CoveringNumerical DataCategorical DataDigital DataData collectionData analysisData Sorting and FilteringData visualization and representationBinary, QR and more
Grades:
3rd - 10th, Adult Education, Staff
Types:
Showing 1-24 of 833 results


