16 results
High school statistics resources for Microsoft OneDrive and for staff and administrators
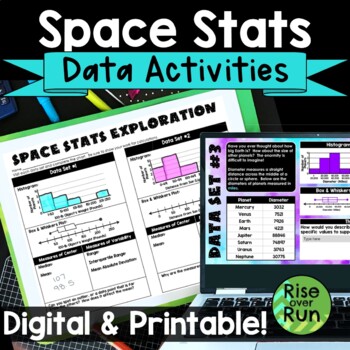
Box and Whiskers Plots and Histograms Activity with Real World Space Statistics
Use statistics for a real world application with this engaging activity about space stats! Students use real data to create histograms, box and whiskers plots, as well as calculate median, mean, range, interquartile range, and mean absolute deviation. This lesson works great for a space room transformation if you choose! Components are included in printable versions for in-person learning and Google Slides + Microsoft PowerPoint for online learning.Here’s what is included:Intro Presentation (Po
Subjects:
Grades:
6th - 9th
Types:
Also included in: Algebra 1 and 8th Grade Math Curriculum Bundle for Entire Year
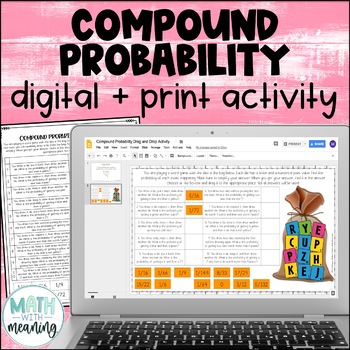
Compound Probability Digital and Print Activity for Google Drive and OneDrive
Looking for an engaging, no-prep activity to practice finding the probability of compound events? Students will use the included image to find the probability of 10 compound events, including both independent and dependent events. They will then find their answer from the answer choices at the bottom and drag it to the appropriate spot. Please view the preview file to make sure that this activity is appropriate for your students.This product includes the following:A link to the digital activity
Subjects:
Grades:
6th - 9th
CCSS:
Also included in: Middle School Math Digital and Print Activity Bundle Volume 1
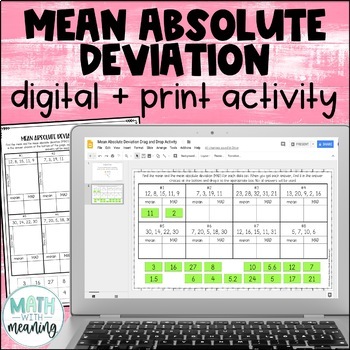
Mean Absolute Deviation MAD Digital and Print Activity for Google Drive
Looking for an engaging, no-prep activity to practice finding the MAD? Students will find the mean and mean absolute deviation for 8 data sets. They will then then find their answer from the answer choices at the bottom and drag it to the appropriate spot. Each data set contains 4-5 numbers. The mean of each data set is a whole number. Please view the preview file to make sure that these types of problems are appropriate for your students.This product includes the following:A link to the activit
Subjects:
Grades:
6th - 9th
CCSS:
Also included in: Middle School Math Digital and Print Activity Bundle Volume 2
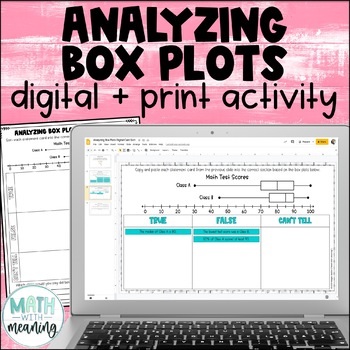
Box and Whisker Plot Digital and Print Card Sort - Reading and Analyzing
Looking for an engaging, no-prep activity to practice reading and analyzing box plots? Students will look at a double box plot and determine if statements about it are true, false, or if they can't tell from the information given in this fun digital and print activity.This activity includes statements about the minimum, maximum, median, quartile 1 (Q1), quartile 3 (Q3), interquartile range (IQR), and range of the box plots, along with statements about the percentages represented by a particular
Subjects:
Grades:
6th - 9th
Also included in: Middle School Math Digital and Print Activity Bundle Volume 3
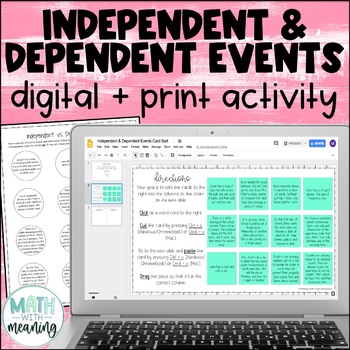
Independent and Dependent Events Digital Print Card Sort - Compound Probability
Looking for an engaging, no-prep activity to practice identifying independent and dependent events? Students will read 12 sets of compound events and determine if they are independent or dependent events. Many examples of real-world events are included. This is a great activity for students learning compound probability who struggle with differentiating between independent and dependent events. Also included is a printable graphic organizer that is perfectly sized for interactive notebooks. Plea
Subjects:
Grades:
6th - 9th
CCSS:
Also included in: Middle School Math Digital and Print Activity Bundle Volume 2
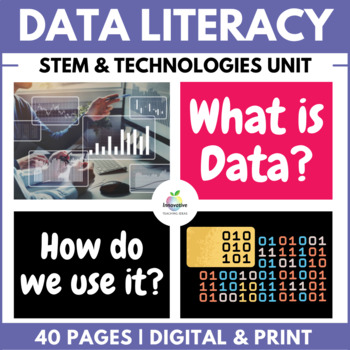
Data Literacy in STEM & Digital Technologies | Numerical, Categorical & Digital
Enhance your student's understanding of DATA LITERACY and DIGITAL LITERACY What is Data? Why it's important? How do numerical, categorical, and digital data fit within STEM and DIGITAL TECHNOLOGIES?Well, look no further... This bundle contains everything you need to teach the essentials of DATA LITERACY with absolutely NO PREP REQUIRED.CoveringNumerical DataCategorical DataDigital DataData collectionData analysisData Sorting and FilteringData visualization and representationBinary, QR and more
Grades:
3rd - 10th, Adult Education, Staff
Types:
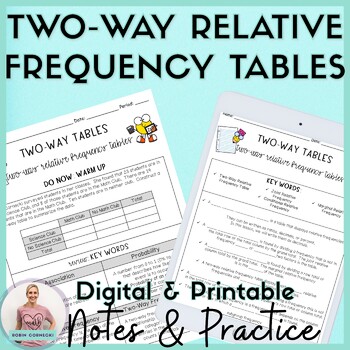
Two Way Relative Frequency Tables Guided Notes Practice HW 8th Grade Math
Two-Way Relative Frequency Tables Guided Notes is everything that you need to teach your middle school math students Constructing and Interpreting Two-Way Relative Frequency Tables. Students will also identify Joint Relative Frequency, Conditional Relative Frequency, and Marginal Relative Frequency through investigation and practice examples. These guided notes and practice worksheets are perfect for a binder or can be reduced in size to fit into an interactive notebook.✅This resource is pe
Subjects:
Grades:
7th - 9th
Types:
Printable Graph Paper 10 Squares Per Inch Cross Stitch
Printable Graph Paper 10 Squares Per Inch Cross Stitch - Grid paper is essentially the type of paper most commonly used for drawing and sketching purposes. It is widely used for making plan charts, designing websites, developing home ideas and so forth. A great deal of businesses who need to produce a company card, business brochures, catalogues, brochures, and so forth need this kind of graph paper.
Subjects:
Grades:
5th - 12th
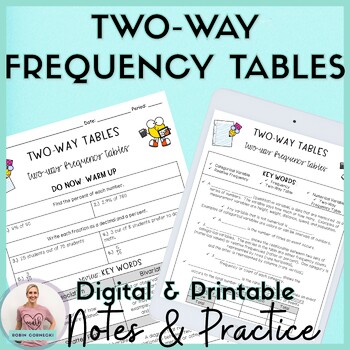
Two Way Frequency Tables Guided Notes Practice Homework 8th Grade Math
Two-Way Frequency Tables Guided Notes is everything that you need to teach your middle school math students about two-way tables and relative frequencies. Students will construct Two-Way Frequency Tables and decide whether there is an association through an investigation and practice examples. These guided notes and practice worksheets are perfect for a binder or can be reduced in size to fit into an interactive notebook.✅This resource is perfect for Distance Learning (zero prep) or in the cla
Subjects:
Grades:
7th - 9th
Types:
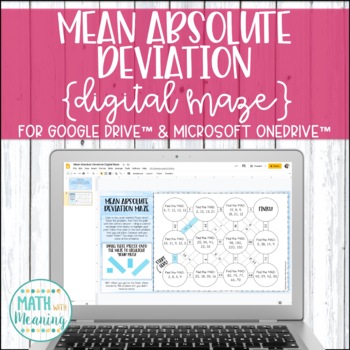
Mean Absolute Deviation DIGITAL Maze Activity for Google Drive Distance Learning
Students will practice solving problems involving mean absolute deviation with this fun digital maze activity! Students will end up solving a total of 10 problems.Each data set contains 4-6 numbers. The mean of each data set is a whole number. Please view the preview file to make sure that these types of problems are appropriate for your students.This product includes the following:A link to the activity on Google Slides including student directionsA PowerPoint version of the activity that can b
Subjects:
Grades:
6th - 9th
CCSS:
Also included in: Middle School Math DIGITAL Maze Activity Bundle for Google & OneDrive
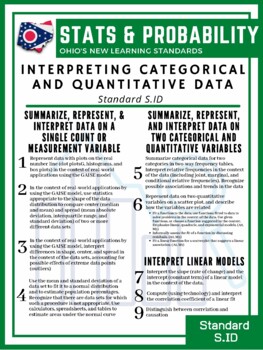
Ohio's Statistics & Probability Standards - Poster Edition
Ohio's STATISTICS & PROBABILITY StandardsThis set of 4 Posters covering all 31 standards can be downloaded and printed into any size paper you wish. The default is 18"x24" for easy viewing on your classroom walls. Want to make the Statistics & Probability Standards come alive in a visually appealing manner -- Get these today!Whether for your wall or to make a booklet for your students, these are a great way to keep the standards in front of your students.
Subjects:
Grades:
9th - 12th
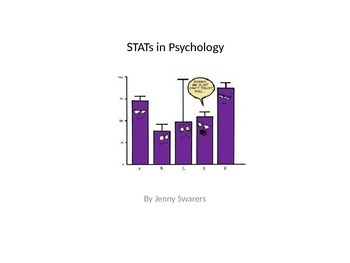
basic statistics in psychology
Powerpoint to help prepare educators in understanding the basic terms behind psychological evaluations used in special education.
Subjects:
Grades:
9th - 12th, Higher Education, Adult Education
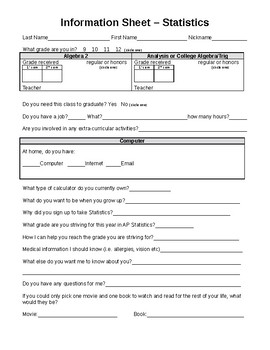
Information Sheet - Statistics
To be used at the beginning of the year to get to know your students better.
Subjects:
Grades:
9th - 12th
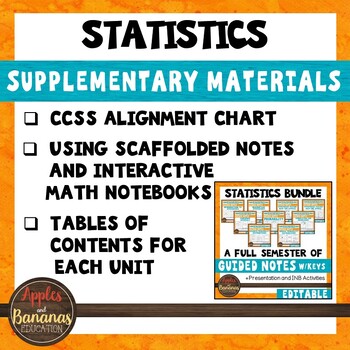
Statistics Bundle Supplementary Materials and CCSS Alignment Guide
This product contains three components: a CCSS Alignment Guide (to determine which standards are addressed in each unit of our Statistics Bundle), a "How to Use" guide, and a detailed Table of Contents for each unit in our Statistics Interactive Notebook Bundle.These supplementary materials can help you determine if the Statistics Bundle is a good purchase for you. If you have already purchased our materials, these products will provide additional organization tools to help you plan and prepare.
Subjects:
Grades:
9th - 12th
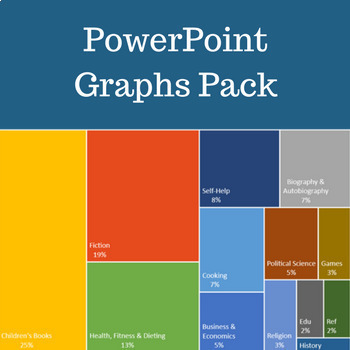
PowerPoint Graphs for Data Visualization and Presentation
This free version includes 9 fully editable PowerPoint graphs.
★ Download 100+ PowerPoint Graph Templates for Data visualization and Presentation (with FREE UPDATES) ★
Get all stunning data chart templates here - 100+ PowerPoint Graph Templates for Data visualization and Presentation (with FREE UPDATES)
Subjects:
Grades:
5th - 12th, Higher Education, Adult Education, Staff
Showing 1-16 of 16 results


