6 results
Common Core HSS-ID.A.2 resources for special education
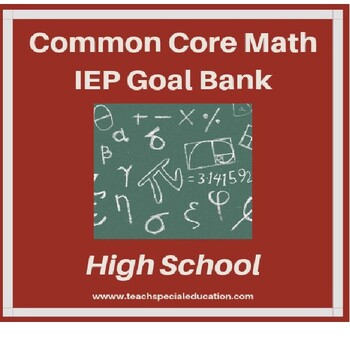
High School Math Common Core Aligned IEP Goal Bank
This IEP goal bank was created to assist special education teachers with the task of writing standards-based IEP goals in math. After spending countless hours developing IEP goals myself and really having to think through how to best individualize goals and objectives for my own students, I wanted to share this resource to help other special education teachers gain back some of their time.This goal bank includes the following:An introduction and guide that explains how to use the document.Each s
Subjects:
Grades:
9th - 12th
CCSS:
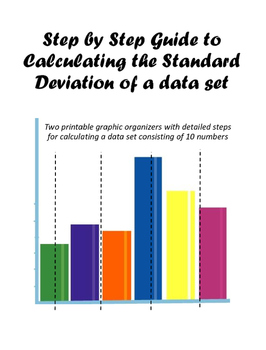
A Step-by-Step Guide to Calculating the Standard Deviation of a Data Set
This is set contains two standard deviation graphic organizers for students just introduced to the concept of standard deviations, students having trouble calculating the standard deviation of a data set, or students who require graphic organizers as a classroom accommodation.
The first organizer has a given data set (10 numbers total) and students fill in the boxes as they progress through each step of finding the standard deviation. The second does not give a data set, but is set up to wor
Subjects:
Grades:
9th - 12th
CCSS:
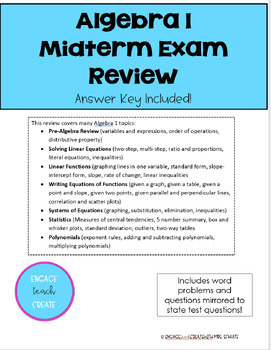
Algebra 1 - Mid-Term Exam Review with Key
This review covers many Algebra 1 topics: · Pre-Algebra Review (variables and expressions, order of operations, distributive property) · Solving Linear Equations (two-step, multi-step, ratio and proportions, literal equations, inequalities) · Linear Functions (graphing lines in one variable, standard form, slope-intercept form, slope, rate of change, linear inequalities· Writing Equations of Functions (given a graph, given a table, given a point and slope, given two points, given parallel and pe
Subjects:
Grades:
8th - 11th
Types:
CCSS:
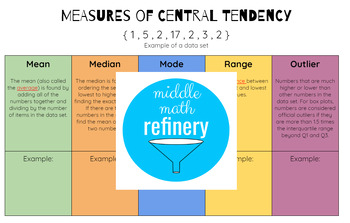
Measures of Central Tendency (Mean, Median, Mode, Range, Outlier)
This user-friendly resource is a great reference sheet for students learning about measures of center (mean, median, mode, range and outliers). Having tools like this to reference while working helps students to remember concepts and encourages self-reliance and ownership of own's learning. This resource works well in a graphic organizer and also word walls.Included: black and white printablecolor printableblack and white printable with answer keycolor printable with answer key
Subjects:
Grades:
6th - 10th
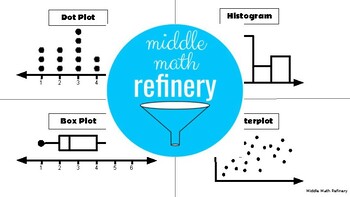
Printable: Types of Graphs (Dot Plot, Histogram, Box Plot, Scatterplot)
This easy-to-use resource features the four (4) types of graphs students learn about in middle school math and high school statistics: dot plots, histograms, box (or box and whiskers) plots and scatterplots. Great to use for scaffolded notes or on your word wall!Features:One (1) blank/ fillable page with missing names of graphsAnswer key with labels
Subjects:
Grades:
6th - 10th
CCSS:
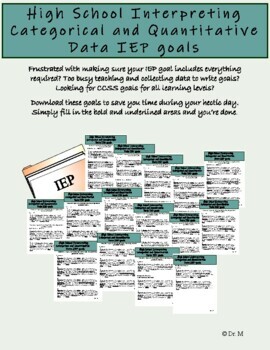
High School Interpreting Categorical and Quantitative Data IEP math goals
Do you feel frustrated and overwhelmed with everything on your plate? No need to sweat the small stuff. Relieve your current and future headaches with these premade IEP goals. There is no mixing and matching needed. This premade Interpreting Categorical and Quantitative Data IEP math goals packet is designed to save you valuable time, frustration, and headaches. Simply fill in the bold information to personalize each goal. This is a high school Interpreting Categorical and Quantitative Data IEP
Grades:
9th - 12th
Types:
CCSS:
Also included in: Algebra 1 IEP Math Goals
Showing 1-6 of 6 results

