TPT
Total:
$0.00
Selected
Subjects
25 results

Science Common Core HSS-ID.A.1 resources
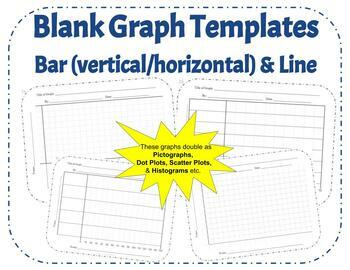
Preview of 42 Blank Graph Templates: Horizontal & Vertical Bar Graph, Line Graph, Printable
42 Blank Graph Templates: Horizontal & Vertical Bar Graph, Line Graph, Printable

Looking for an array of printable graph templates for all your future bar and line graph needs? Look no further! With 42 different templates ranging for bar graphs, to line graphs, varying in X values and Y values, this combination should be the last graph download you need to worry about for your class. These graphs can even be used as Histograms, Dot Plots, Scatter Plots, or a variety of other graphs to suit the needs of your classroom.I created this template to require all the basics of gr
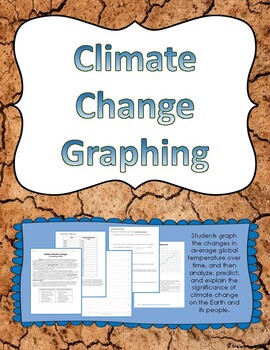
Preview of Climate Change Graphing Activity

Climate Change Graphing Activity

Created by
Kimberly Frazier
Students graph the changes in average global temperature over time, and then analyze, predict, and explain the significance of climate change on the Earth and its people.Students read info related to climate change, then create a graph of average global temperature changes over the past 140 years. Students are then to answer several analysis questions, which could also be used to drive a meaningful classroom discussion about climate change.Included is a teacher's key which shows what the resulti
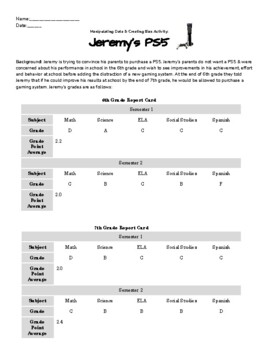
Preview of Manipulating Data & Creating Bias Activity
Manipulating Data & Creating Bias Activity

Manipulating Data & Creating Bias Activity: Teach your students about how charts and statistics can be skewed; and real numbers can reflect bias with this fun project! Students are given a role (either Jeremy or his parents) and have to use two pieces of data from Jeremy's 6th & 7th grade report card to argue for or against his deserving of a PS5!Students get to be creative & make cross-curricular connections to ELA as they use logical fallacies & skewed graphs to make their argu
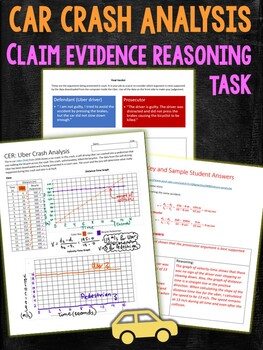
Preview of Self Driving Car Crash Analysis Claim Evidence Reasoning Task
Self Driving Car Crash Analysis Claim Evidence Reasoning Task

Created by
Mrs Lyons
In this task students will analyze a car accident which caused a fatality. Students will graph the distance-time data downloaded from a self-driving car. They will then determine the rate of change of distance, that is the velocity of the objects involved, and create a corresponding velocity-time graph. Finally students will construct a scientific explanation using the framework of claim-evidence and reasoning on whether the data supports the case of the prosecutor or the defendant.I used this w
Preview of Graphing in Science: A Google Slides Lesson PLUS Guided Notes Handout!
Graphing in Science: A Google Slides Lesson PLUS Guided Notes Handout!

This EDITABLE Google slides (powerpoint) presentation AND guided notes handout covers all of the essential information students need to create and analyze graphs in science. This lesson is designed to refresh students on the concepts of creating graphs using scientific data, analyzing relationships between independent and dependent variables, and includes lots of examples and practice opportunities! This lesson can be used to introduce the important concepts of graphing in science, or it can be
Preview of 6 Editable Bar Graph Templates 2.0

6 Editable Bar Graph Templates 2.0

Finally a simple and professional graph space that students can fill out without any design issues getting in the way. This file contains 6 ready-to-use graph options. Print them and have students fill them with pencil and ruler, or distribute them over computer and let them practice entering the data. Get a project perfect finish every time. Maybe you just want to fill it out live on a projector? The possibilities are endless! It's okay to say you love these bar graphs. So do we.Contains:- 2 bl
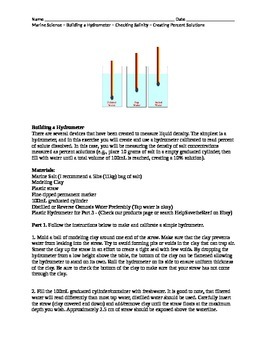
Preview of Marine Science Biology Making a Hydrometer Making Percent Solutions
Marine Science Biology Making a Hydrometer Making Percent Solutions

Created by
HelpSavetheReef
This laboratory experience enables students to create a hydrometer using clay and straws to measure unknown solutions. Students begin by calibrating their devices using percent solutions that they must make. They can then use their device to measure unknown solutions provided by the instructor. Students are asked to convert units of measure. Additional research questions are provided that go beyond the laboratory activity.
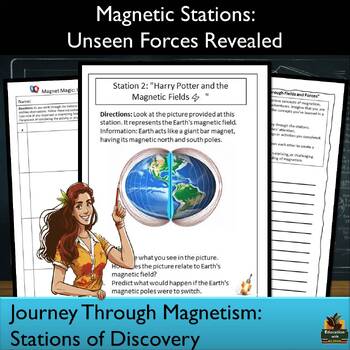
Preview of Physical Science Magnetism: Stations for High School with Digital Included!
Physical Science Magnetism: Stations for High School with Digital Included!

Hello there! Let me tell you about this fantastic resource I've created to help you teach Magnetism in a way that's engaging, interactive, and super low-prep. Introducing the "Magnetism Stations: High School Physical Science Lesson" Here's what you'll get when you grab this set of resources: Engaging Stations: Capture your students' attention with 8 activities designed to help them explore and master Magnetism. (Ferromagnetism, Electromagnet, Magnetic Field, and more) Digital Version Include
Preview of STEM Small Bean Bag Launcher Project - Mean, median, mode, box and whisker plots

STEM Small Bean Bag Launcher Project - Mean, median, mode, box and whisker plots

Students use the engineer design process to create a small bean bag launcher with the goal of hitting a target. Students then calculate the mean, median, and mode of the distance from the bullseye, as well as make a box-and-whisker plot of the data. The data is used to revise the design in order to make it more accurate.
Preview of Teaching with Baseball Statistics

Teaching with Baseball Statistics

Created by
Cecile Greene
I use this activity to teach my science students how to model an idea using data. Students learn to predict the outcomes of a baseball pitcher based on their last 3 years of stats. Students learn to analyze their data and determine trends in the data. Students also learn to compare data from their pitcher to other students' pitchers (collaboration). Students also must be able to/learn to accurately graph their data. There is also a research component as students must research their pitcher's
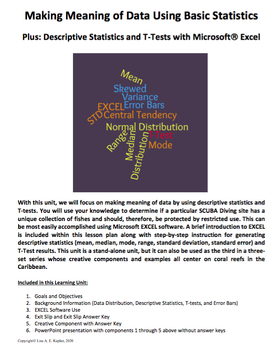
Preview of Making Meaning of Data Using Basic Statistics – Plus Statistics with EXCEL
Making Meaning of Data Using Basic Statistics – Plus Statistics with EXCEL

This learning unit includes two files ­– a PDF document and a PowerPoint presentation. The PDF includes the following components and can be used solely by the teacher or modified to remove the assessment pieces and distributed to the students. 1. Goals and Objectives2. Background Information a. Data Distribution, Descriptive Statistics, T-tests, and Error Barsb. EXCEL Software Use3. Assessmentsa. Exit Slip and Exit Slip Answer Keyb. Creative Component with Answer Key All of the background info
Preview of Graphing and Data Analysis Practice

Graphing and Data Analysis Practice

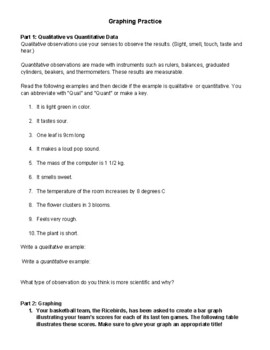
A good practice for a high school science class after teaching students about different types of graphs and quantitative vs qualitative data. Can be used as an independent work packet in class or homework. Perfect for a remote assignment!
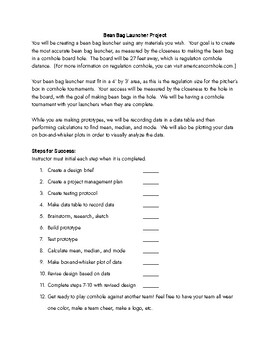
Preview of Bean Bag Launcher Engineering Project - Mean, median, mode, box-and-whisker plot
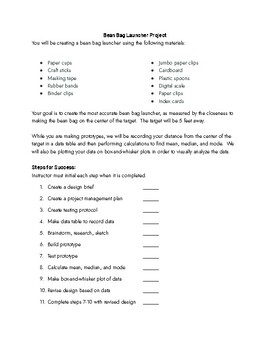
Bean Bag Launcher Engineering Project - Mean, median, mode, box-and-whisker plot

Students create a bean bag launcher to play cornhole! They follow the engineer design process, have constraints set in place, and have a goal of being the most accurate launcher. Students must create a design brief, project management plan, testing protocol, data table to record data, and create a prototype. With their data, students calculate mean, median, and mode, and then create a box-and-whisker plot to analyze their data. After revising their prototype, students play in a friendly corn
Preview of Experimental Variables and Graphing

Experimental Variables and Graphing

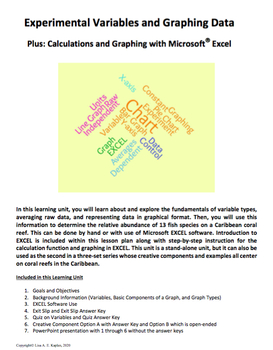
This learning unit includes two files ­– a PDF document and a PowerPoint presentation. The PDF includes the following components and can be used solely by the teacher or modified to remove the assessment pieces and distributed to the students. 1. Goals and Objectives2. Background Information a. Variables, Components of a Graph, Graph Typesb. EXCEL Software Use3. Assessmentsa. Exit Slip and Exit Slip Answer Keyb. Quiz on Variables and Answer keyc. Creative Component Options A with Answer Key and
Preview of Speed, Velocity and Acceleration Learning Activities
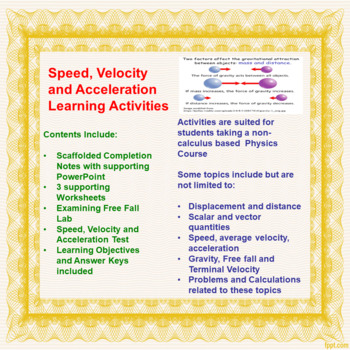
Speed, Velocity and Acceleration Learning Activities

This zip file contains many different activities (54 pages of student handouts and 1 PowerPoint with a total of 47 slides) which can be used to compose a unit for physics students involving topics involving Speed, Velocity and Acceleration. Topics in this unit include distance, displacement, scalar and vector quantities, speed, velocity, average velocity, acceleration, free fall, calculations involving these topics as well as many other concepts.A free fall lab activity is contained within this
Preview of First Week- Graphic Notes for Crash Course Geography
First Week- Graphic Notes for Crash Course Geography

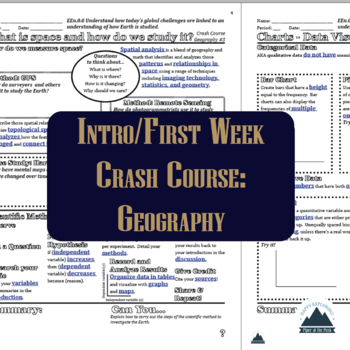
If you haven't checked out Crash Course: Geography, you should! Alizé Carrère hosts this series which takes learners around the world in each episode highlighting the diverse aspects of the Earth and the people who study it. Plus some of the related channels are relevant to Earth/Environmental Science.This first set of notes includes four episodes that I use in the first week of Earth/Environmental Science. Here are the links to not only the videos, but also transcripts of each episode.What i
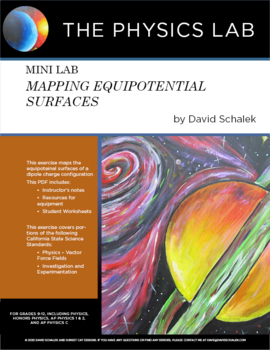
Preview of High School Physics - Mini Lab: Mapping Equipotential Surfaces

High School Physics - Mini Lab: Mapping Equipotential Surfaces

Created by
The Physics Lab
This quantitative, inquiry based laboratory exercise for physics classes examines the mapping of equipotential surfaces for a dipole charge configuration. Applicable to Physics, Honors Physics, and AP Physics classes.Instructor's Notes and Student Worksheets are included.This exercise covers portions of the following California State Science Standards:Physics - Vector Force FieldsInvestigation and ExperimentationPlease follow my store, The Physics Lab! Thank you!David Schalek is an award winning
Preview of Data Discovery

Data Discovery

Use this activity at the beginning of the school year in Science class to teach and refine data collection skills, build conversations about data analysis, and graphs vs. tables. Students will use classroom items and collect data from their peers to determine how to graph and organize information they have collected. Scientific method, data analysis, or an icebreaker for science.
Preview of Invasion of the Crabs! Lesson Plan and Activities
Invasion of the Crabs! Lesson Plan and Activities

Created by
Sea Grant
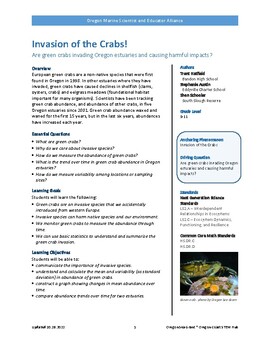
Are green crabs invading Oregon estuaries and causing harmful impacts?This lesson plan from Oregon Sea Grant includes:Introduction lesson with video resources"Introduction to Invasive Green Crabs in Oregon" activity with narrated presentation and slides, and handouts"Species on the Move" activity with article and worksheet"Green Crab Abundance" activity with student dataset handout and worksheet, and teacher guidance and answer key"Data analysis" activity for student presentations of dataField t
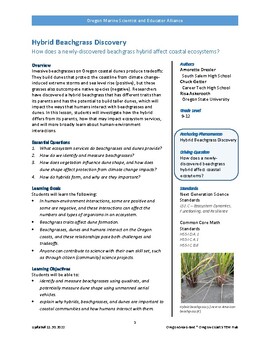
Preview of Hybrid Beachgrass Lesson Plan and Activities
Hybrid Beachgrass Lesson Plan and Activities

Created by
Sea Grant
How does a newly-discovered beachgrass hybrid affect coastal ecosystems?This lesson plan by Oregon Sea Grant includes:"Discovering New Organisms" activity with vocabulary handout, and lesson presentation"Life Imitating Art" activity with reading source"Dunes of Ecology" activity with presentation and handout"Hybrid Beachgrass Discovery" activity with video, handout, field project, and classroom project"Career Connections" activity with internet resource and handout"Visualizing Data" activity wit
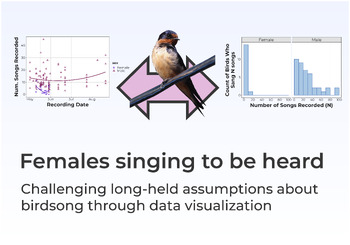
Preview of Females Singing To Be Heard: Interdisciplinary Science Mini-Unit
Females Singing To Be Heard: Interdisciplinary Science Mini-Unit

This FREE, interdisciplinary mini-unit is all about challenging long-held assumptions about birdsong through data visualization. The Gist: Students will learn how data visuals tell a story. They will analyze real bird song data to try to understand why female singing behavior has been overlooked in one of the most common birds in the world. They will also gain a deeper insight into the scientific peer review process.Driving Questions: What is the best way to visualize data?How do our assumption
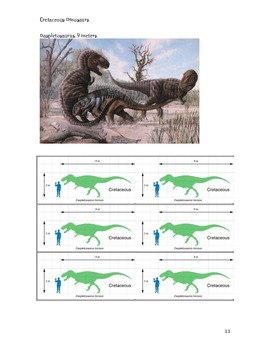
Preview of Dinosaur Cards to Find the Mean,Median and Mode
Dinosaur Cards to Find the Mean,Median and Mode

Created by
Kelly DeRango
This lesson has students cut out dinosaur cards from the provided worksheets. Each card contains a picture of the dinosaur, its name, the period (Triassic or Cretaceous) and its length. Students are asked to order the cards from smallest to largest and then compute the mean, median and mode of the distributions. Dinosaurs changed dramatically from the Triassic to Cretaceous period. Dinosaurs were very small during the Triassic period but became huge by the time the Cretaceous period arrived.
Preview of Learn-a-long: 'Nice Genes!' Episode 5
Learn-a-long: 'Nice Genes!' Episode 5

Created by
Geneskool
The download is a PDF for students to help follow along with Episode 5 of the Nice Genes! Podcast found HEREJust like any good superhero comic, we start this episode with the science going incredibly wrong. Think: vats of toxic waste producing evil mutants that ravage the city. Or maybe not so evil. It really depends on your perspective. Just like the X-men, genetic mutations get a bad rap in the public eye. But they aren’t all nasty.Dr. Kaylee Byers speaks with data scientist and evolutionary b
Preview of Earthworms Response to Temperature

Earthworms Response to Temperature

Created by
Trecia Neal
This is a lab for Middle School and High School Science classes. It uses Red Wigglers, Eisenia fetida, to manipulate temperature variables to affect the worm's pulse rate. Red Wigglers are easy to work with and allow students to see the blow flow through the closed circulatory system and calculate the pulse rate of the worm. This lab uses graphing and data collection to help students understand how science accumulates data to make inferences about how conditions affect animals.
Showing 1-24 of 25 results

Find Science resources | TPT

Importance of learning science

Learning science is particularly important for students as it equips them with the essential knowledge and skills to make sense of the world around them. Science education is not just about memorizing facts. It fosters critical thinking, inquiry, and problem-solving abilities. These skills are not only useful in school but also in everyday life beyond the classroom.

Benefits of learning science

Learning science offers many benefits to students both in school and beyond. In fact, it helps students:

  • Question the world around them and seek evidence-based explanations
  • Cultivate their ability to observe, experiment, and analyze data
  • Nurture a sense of curiosity, awe, and wonder about the natural world
  • Understand natural phenomena and the laws that govern the universe

With a solid foundation in science, teachers can help empower students to think critically, solve problems, make informed decisions, and engage with the world around them in meaningful ways.

Teaching with science resources

One of the best parts about science class is all of the possibilities for hands-on, collaborative learning! Think: labs, experiments, inquiry-based activities, and design challenges. These activities encourage students to explore scientific concepts by observing, asking questions, and conducting investigations. Additionally, with small group centers, students can engage in group experiments, discussions, and projects that require them to collaborate, share ideas, and solve problems together.

Discover printable and digital science resources

If you’re a teacher or parent looking for printable or digital science resources, TPT has an extensive array of instructional materials for every learning need, topic, or grade level. Whether you're learning about plant parts or butterfly life cycles, or exploring advanced topics like the anatomy of a cell or Newton’s laws of motion, we've got you covered.

On TPT, science resources come in various forms: from labs and worksheets to craftivities and doodle notes. They can be used to enhance learning, assess a student’s mastery of science concepts, or to reteach a tricky topic. With plenty of TPT resources at your fingertips, teaching and learning science will be so much easier. Plus, you can expand students’ knowledge even further by exploring TPT math resources, which are frequently paired with science lessons.

Frequently asked questions about teaching science

What types of science lessons are available on TPT?

There are many different types of science resources sold by Sellers on TPT. Some popular science lessons include biology, earth sciences, chemistry, environment, engineering, and anatomy.

How do I find science lessons on TPT?

Educators can save time preparing science lessons with resources created by experienced teachers. Simply start a search for science resources on the TPT marketplace, and filter by grade level, price, and/or resource type to find materials that've been proven to work in classrooms like yours. No matter what you’re teaching, there are plenty of science lessons and activities sold by Sellers on TPT that are tailored to meet your students' skill levels.

How can I make my science lessons fun and engaging?

Students learn best when they're engaged! Sprinkle a little fun into your science lessons and make them feel like real scientists by investigating everyday objects, exploring the world outside the classroom, and doing hands-on and collaborative experiments and design challenges.