4 results
High school statistics scripts for Montessori

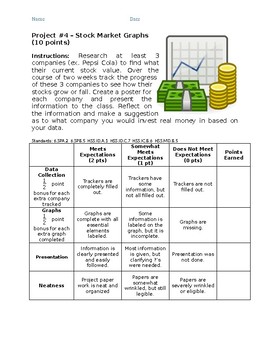
Stock Market Graphs
Students use their skills to track and interpret trends with at least 3 current companies. They collect data on stock price for two weeks, graph the information, then make predictions about what they think will happen based on the trends. Great for use in finance and investment classes, math, or science to collect and analyze data. I used this in my middle school RTI classes for project-based learning. Let me know what you think or how I might make it better. Thank you!
Subjects:
Grades:
6th - 12th
Types:
Also included in: Math Projects Bundle

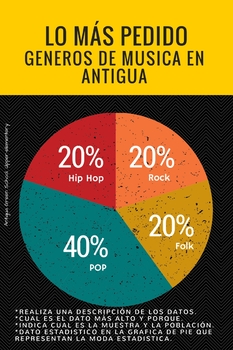
Montessori Material Upper-Elementary, Statistical Activity
Statistical activity. English-Espanish
Subjects:
Grades:
4th - 10th
Types:

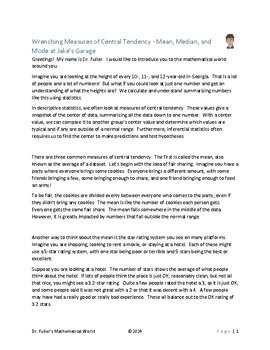
Wrenching Measures of Central Tendency: Mean, Median, and Mode (Script)
The script for the video Wrenching Measures of Central Tendency: Mean, Median, and Mode by MisplacedDecimal, LLC. This video is freely available on YouTube at: https://youtu.be/VGgGSAixJ6E
Subjects:
Grades:
6th - 10th
Types:

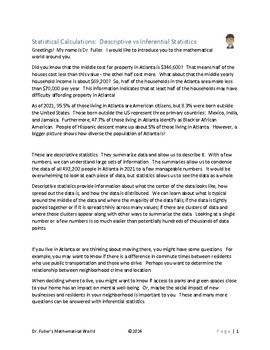
Statistical Calculations: Descriptive vs Inferential Statistics (Script)
The script for the video Statistical Calculations: Descriptive vs Inferential Statistics by MisplacedDecimal, LLC. This video is freely available on YouTube at:https://youtu.be/U4Ddd77vwzQ
Subjects:
Grades:
4th - 9th
Types:
Showing 1-4 of 4 results


