34 results
Statistics resources for Microsoft Excel and for homeschool
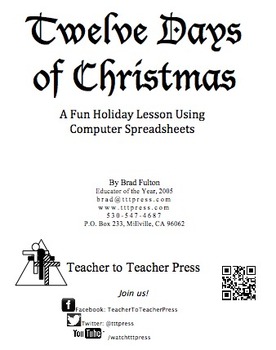
12 Days of Christmas: A Computer Spreadsheet Activity
This great holiday activity shows students how to use a computer spreadsheet to calculate the cost of their true love's gifts in today's dollars.The simple step-by-step procedure will allow both beginning and computer-savvy students to experience success as they learn how to use spreadsheet software. Students will enjoy the engaging and entertaining activity. No computer? No problem! Use the activity master so students can calculate the costs themselves.
Grades:
5th - 9th
Types:
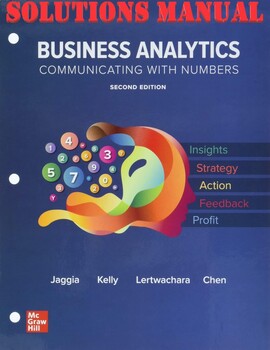
Business Analytics 2nd Edition Sanjiv Jaggia, Alison_SOLUTIONS MANUAL
SOLUTIONS MANUAL for Business Analytics, Communicating with Numbers 2nd Edition by Sanjiv Jaggia Professor, Alison Kelly Professor The download file inludes:Complete Chapters 1-18Compressed zip folder INSTRUCTOR MANUAL ALL CHAPTERSR Code GuidePython Guide and SolutionsExcel Spreadsheets and WorkBookSyllabus Undergrad Business AnalyticsSylabus Business Analytics and Data Mining for BusinessAppendix
Subjects:
Grades:
Higher Education, Adult Education, Staff
Types:
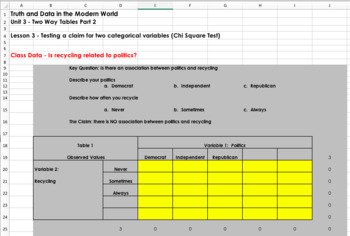
Teaching Statistics with Spreadsheets (Self Grading)
You can see a video that describes the basics of this course at the following link: https://www.youtube.com/watch?v=uZFpltXWyw8This package is an entire statistics course designed for content to be delivered, taught, practiced, and assessed through spreadsheets. Students learn basic statistics and spreadsheet skills. This course is intended to allow for student collaboration and group work throughout the learning process. Each spreadsheet is automatically graded so students can see their progres
Grades:
9th - 12th
Types:
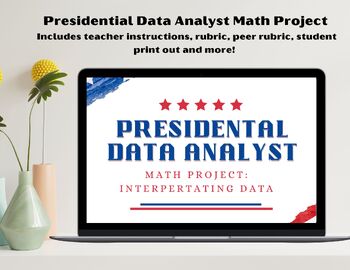
Presidential Data Analyst Math Project | Excel | Presentations | Presidents Day
Elevate your Presidents' Day lesson plans with this comprehensive Presidential Data Analysis Math Project, designed to engage students in a deep exploration of U.S. presidential history through mathematical analysis. This invaluable resource provides educators with everything they need to guide their students through a dynamic and informative project that combines historical research with mathematical concepts.**Key Features:**1. **Thematic Relevance:** - Aligned with Presidents' Day, this o
Subjects:
Grades:
7th - 10th

Simple Probability Cinco de Mayo Math Pixel Art Mystery Picture Editable DIGITAL
No Prep Interactive Math Game - DIGITAL Cinco de Mayo, Mexico activity - Probability of Simple Events - EDITABLE in Google Sheets™/ Excel™.It is a perfect spring, May activity for distance learning, morning work, math centers, early finishers, substitutes, and homework.In this digital resource, students will practice finding the probability of simple events.This is a self-checking activity.If your answer is correct, a Mystery Picture will show up.If the answer is incorrect, the answer will turn
Subjects:
Grades:
6th - 8th
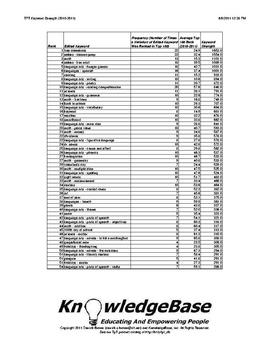
TPT KeyWord Strength Index (2010-2011) - Downloadable Spreadsheet!
What are the strongest keywords on TpT?
1. free downloads
2. Deanna Jump
3. math
Neither #1 nor #2 are surprises, but #3 (math) was certainly a surprise to me!
This report analyzes TpT's 2010-2011 keywords using a measure called "keyword strength".
The measure is based on a keyword's average rank, as well as the number of times it appeared in the 2010-2011 "Top 100" TpT search engine rankings.
This can be a valuable tool to help sellers understand TpT's marketplace supply and demand!
The P
Subjects:
Grades:
PreK - 12th, Higher Education, Adult Education, Staff
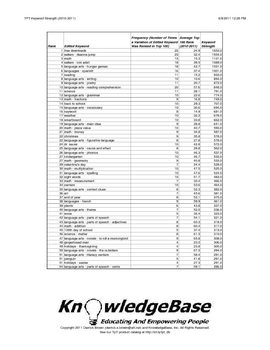
TPT KeyWord Strength Index (2010-2011) - Downloadable PDF!
What are the strongest keywords on TpT?
1. free downloads
2. Deanna Jump
3. math
Neither #1 nor #2 are surprises, but #3 (math) was certainly a surprise to me!
This report analyzes TpT's 2010-2011 keywords using a measure called "keyword strength".
The measure is based on a keyword's average rank, as well as the number of times it appeared in the 2010-2011 "Top 100" TpT search engine rankings.
This can be a valuable tool to help sellers understand TpT's marketplace supply and demand!
The P
Subjects:
Grades:
PreK - 12th, Higher Education, Adult Education, Staff
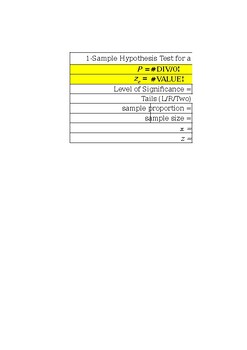
Hypothesis Testing Excel Calculator
Includes 1- and 2- Sample Hypothesis testing for means and proportions
Subjects:
Grades:
11th - 12th, Higher Education
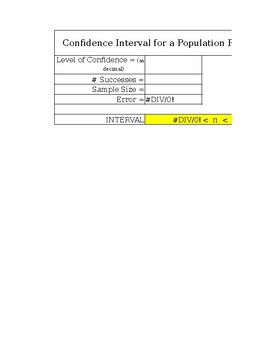
Confidence Interval Excel Calculator
Confidence Intervals for means, proportions, and variances
Subjects:
Grades:
11th - 12th, Higher Education
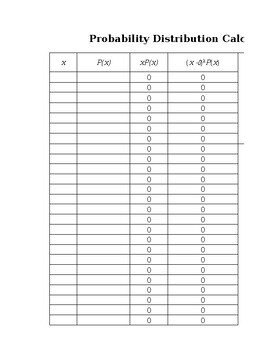
Probability Distribution Excel Calculators
Compute Binomial, Poisson, and Normal Probabilities
Subjects:
Grades:
11th - 12th, Higher Education
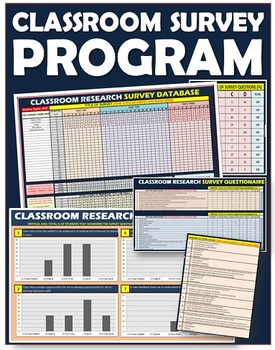
Surveys: Classroom All-IN-ONE Research Program
Empower Your Teaching with Data: Enhance Your Classroom with Powerful Survey Analysis!Elevate your teaching practice by leveraging the power of data with this user-friendly survey analysis program.Here's what sets it apart:Effortless Data Visualization: Transform survey responses into clear and visually appealing charts and graphs.Actionable Insights: Gain valuable insights into student learning styles, preferences, and areas for improvement.Informed Decisions: Make data-driven decisions to enha
Subjects:
Grades:
PreK - 12th, Higher Education, Adult Education, Staff
Types:
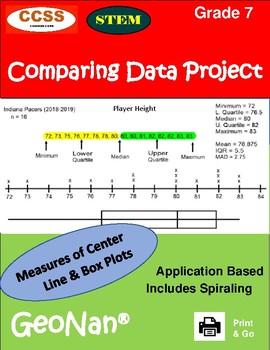
7th Grade Comparing Data Project
Project-Based Learning! Apply the concepts of data analysis. Students will develop Line Plots and Box Plots with calculations for mean, median, upper and lower quartiles, mean absolute deviation, and range. Students become sports analysts and make comparisons between two teams. This 26-page booklet includes Lesson Plans, Activity & Key, Excel Workbook Guide, WebQuest, Word Search & Key, and the Comparing Data Project with Rubric. Everything needed for a Real-World Application of the G
Subjects:
Grades:
6th - 8th
Types:
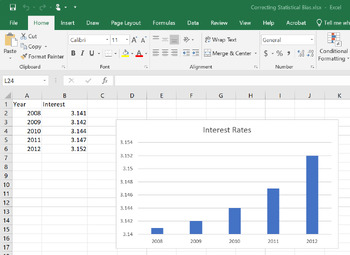
Correcting Statistical Bias with Answer Key
Correcting Statistical Bias is a great tool to use when teaching about statistical bias in the media, news, sports, and politics.It includes 4 graphs that have been manipulated to show bias.You can get your students to practice un-manipulating the graphs using the provided hints to show the real story behind the data and help your students to become more statistically aware.
Subjects:
Grades:
8th - 12th

Math TEKS standards checklist for K-12th grade (TX)
Mathematic TEKS standards checklist for K-12th grade. These are on an Excel spreadsheet with 5 columns for data input and separate tabs for the strands. These standards are organized in their separate strands to coordinate lessons. Please see my free file for an example.
Subjects:
Grades:
K - 12th
Types:
Halloween Statistics 2018 Spreadsheet Activity
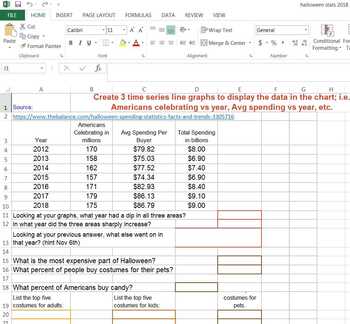
If you are teaching stats and incorporating spreadsheets, this might fit the bill for a fun activity for Halloween. The plus is it does have some educational value, as well as a fun Mystery Image sheet, as well. Students go to a website and read statistical information, then they create line graphs and answer questions in the first spreadsheet. In the second, they are just practicing their spreadsheet formatting skills by following step-by-step instructions to create an image. There are two
Subjects:
Grades:
7th - 12th
Types:

Math TEKS Standards Checklist for All Math High Schools Courses (TX)
Mathematics TEKS standards checklist for all math high schools courses. These are on an Excel spreadsheet with 5 columns for data input and separate tabs for the strands. These standards are organized in their separate strands to coordinate lessons. Please see my free file for an example.
Subjects:
Grades:
9th - 12th
Types:
Calculate Student's Final Marks ( Grades ) in excel
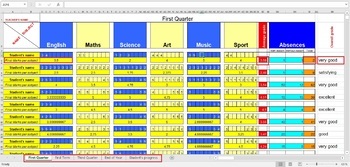
If you want to easily calculate student's marks this excel document is great solution. I added all excel's necesarily formulas to make this important task so easier.When you add the marks for every subject, it's final mark will be automatically calculated. At the same time average grade will also be calculated and updated.There is also section for absences (excused and unexcused) which will also be calculated.At the end, if student's Overall grade is equal or above 4.5, it will be automaticaly w
Subjects:
Grades:
PreK - 12th, Higher Education, Adult Education, Staff
Types:
Correcting Statistical Bias
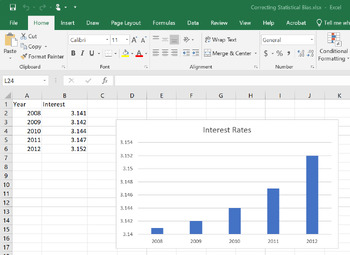
Correcting Statistical Bias is a great tool to use when teaching about statistical bias in the media, news, sports, and politics. It includes 4 graphs that have been manipulated to show bias.You can get your students to practice un-manipulating the graphs using the provided hints to show the real story behind the data and help your students to become more statistically aware.
Subjects:
Grades:
8th - 12th
Also included in: Correcting Statistical Bias with Answer Key
Correcting Statistical Bias Answer Key
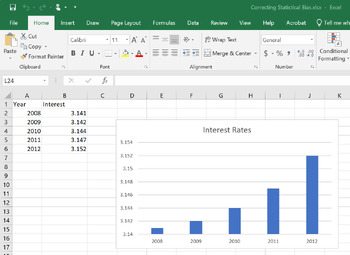
This resource provides the answers for you and your students for the Correcting Statistical Bias lesson.
Subjects:
Grades:
8th - 12th
Also included in: Correcting Statistical Bias with Answer Key
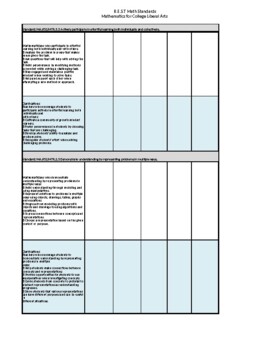
B.E.S.T. Math Standards Checklist for Math for College Statistics (FL)
B.E.S.T math standards checklist for Mathematics for College Statistics on an excel spreadsheet with 5 columns for data input. These standards are organized in their own sub-domains to coordinate lessons. Please see my free file for an example.
Subjects:
Grades:
9th - 12th
Types:
Also included in: All of the B.E.S.T. Math Standards Checklists K-12 (FL)
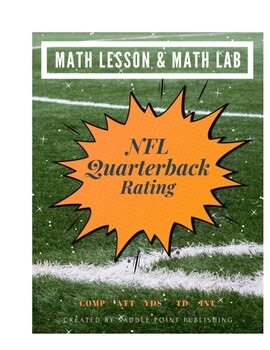
MATH LESSON & MATH LAB on NFL Quarterback Rating
Most people have heard of professional football and the NFL but few people know that there is an actual formula used to calculate ratings for the NFL quarterbacks! This is a tried and true math lesson and lab that I have created and used for many years with my 7th and 8th grade classes. Students get a "kick" out of learning about the actual formula used by the NFL to calculate passer ratings for the quarterbacks. They learn some history about when the rating of quarterbacks first started, anal
Subjects:
Grades:
6th - 10th, Adult Education
Types:

Stock Market Simulation
This product has a full lesson on how to teach students about the stock market. This allows them to actively work with different stocks to find out how stocks can shift and change over time. It can be adapted as a 9 weeks, semester, or even full year project.Included is an introductory PowerPoint, a sample Excel spreadsheet, a handout of the project instructions and a list of tips that I've learned using this that will help you out. This project was originally designed with an Economics class in
Subjects:
Grades:
6th - 12th, Higher Education, Adult Education
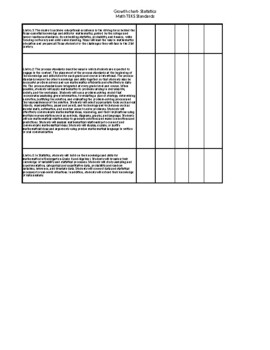
Math TEKS Standards Checklist for Statistics (TX)
This is a Mathematics TEKS Standards checklist for Statistics on an Excel spreadsheet with 5 columns for data input and separate tabs for the strands. These standards are organized in their separate strands to coordinate lessons. Please see my free file for an example.
Subjects:
Grades:
9th - 12th
Types:
Also included in: Math TEKS Standards Checklist for All Math High Schools Courses (TX)
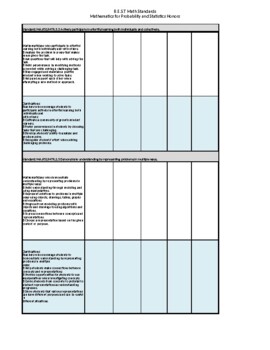
B.E.S.T Math Standards Checklist for Probability and Statistics Honors (FL)
B.E.S.T math standards checklist for Probability and Statistics Honors on an excel spreadsheet with 5 columns for data input. These standards are organized in their own sub-domains to coordinate lessons. Please see my free file for an example.
Subjects:
Grades:
9th - 12th
Types:
Also included in: All of the B.E.S.T. Math Standards Checklists K-12 (FL)
Showing 1-24 of 34 results


