146 results
Statistics resources for Easel Activities and for homeschool
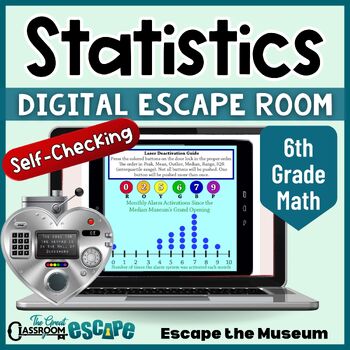
6th Grade Math Data Analysis & Statistics Activity Digital Escape Room Game
Find the median, read the box plot, interpret the frequency table, and unlock the door! This 6th grade math activity based on statistics and probability standards will put your students statistical skills to the test. Your students are volunteer docents at the Median Museum. After the security system locks everyone in, they will need to use their knowledge of statistics to escape the museum. This engaging digital escape room is easy for teachers to implement. The breakout process is fully autom
Subjects:
Grades:
6th - 7th
Types:
Two Way Tables Worksheet
Attention Math Teachers! Download this two-sided worksheet on completing two-way tables and analyzing bivariate data today! This worksheet is perfect for Pre-Algebra and Algebra 1 students as a classwork or homework activity.By completing this worksheet, students will check their understanding of how patterns in bivariate data can be seen by displaying frequencies and relative frequencies in a two-way table. They will also learn how to construct and interpret two-way tables, summarizing and inte
Subjects:
Grades:
8th - 9th
Types:
CCSS:
Also included in: Scatterplots Two Way Tables and Residual Plots Worksheets Bundle
Two Way Relative Frequency Tables Worksheet
Are you a math teacher looking for engaging classwork or homework activities to help your students with relative frequency tables? Look no further! Our worksheet on completing two-way tables and creating relative frequency tables is perfect for your needs. Great for Pre-Algebra and Algebra 1 students. With real-world situations and comprehension questions based on relative frequency tables, students will learn to summarize and interpret data collected from the same subjects. They'll construct an
Subjects:
Grades:
8th - 9th
Types:
CCSS:
Also included in: Scatterplots Two Way Tables and Residual Plots Worksheets Bundle
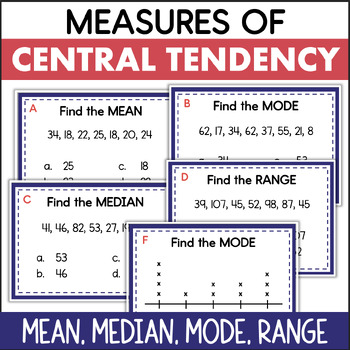
Mean Median Mode Range Measures of Central Tendency Data Task Cards
These data task cards are a great way for students to practice analyzing data to find the mean, median, mode, and range!There are several types of questions, all addressing measures of central tendency. Some require students to interpret a data set of whole numbers. Others involve data presented in a line plot. The last type of question requires the student to choose the correct method for finding the mean, median, mode, or range.This math resource includes:16 task cardsrecording sheetanswer key
Subjects:
Grades:
5th - 7th
Types:
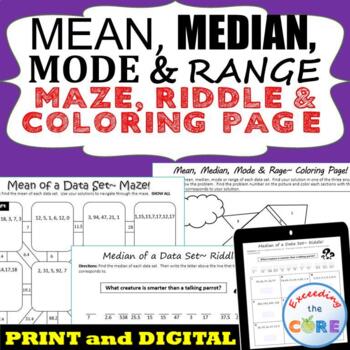
MEAN, MEDIAN, MODE, & RANGE Mazes, Riddles & Coloring Page | Print and Digital
Have your students apply their understanding of finding the MEAN, MEDIAN, MODE, & RANGE of data sets with these fun activities including a maze, riddle and coloring activity. What is Included:1. Finding the Mean MAZEThis is a self-checking worksheet that allows students to strengthen their understanding of finding the mean of positive whole numbers. Students use their answers to navigate through the puzzle.2. Finding the Median RIDDLEStudents find the median of positive whole numbers and use
Subjects:
Grades:
5th - 7th
Types:
Also included in: 6th Grade Math Assessments, Notes, Task Cards, Worksheets BUNDLE
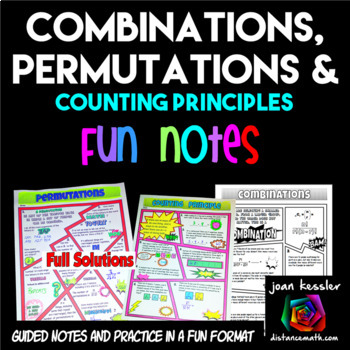
Permutations Combinations and Counting Principle FUN Notes Doodle Pages
Your students will love this Permutations, Combinations, and Counting Principle Fun Notes and Practice resource. Use it in class or as homework, assessment, or enrichment. A fun and engaging format for your students to learn the rules and practice their skills! Great for Algebra and Statistics.This resource contains 3 pages, one each for Permutations, Combinations, and the Fundamental Counting Principle. Students will complete a definitions and formula sections and complete over 20 problems.
Subjects:
Grades:
10th - 12th
CCSS:
Also included in: Algebra 2 FUN Notes Doodle Pages and Practice Bundle
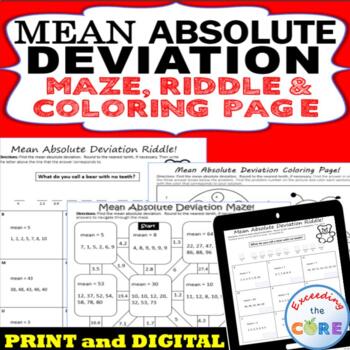
MEAN ABSOLUTE DEVIATION Mazes, Riddles & Coloring Page | Print and Digital
Have your students apply their understanding MEAN ABSOLUTE DEVIATION with these fun activities including a maze, riddle and coloring activity.What's Included:1. Mean Absolute Deviation MAZEThis is a self-checking worksheet that allows students to strengthen their understanding of finding the mean absolute deviation. Students use their answers to navigate through the puzzle.2. Mean Absolute Deviation RIDDLEStudents find the mean absolute deviation of various data sets. Students use their answer
Subjects:
Grades:
5th - 7th
Types:
Also included in: 6th Grade Math Assessments, Notes, Task Cards, Worksheets BUNDLE
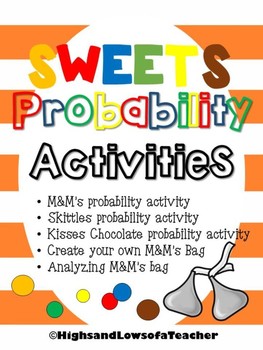
Sweets Probability Activities (chocolate, candy, M&Ms, Skittles, Kisses)
Uses chocolates or candy (M&Ms, Skittles, Kisses) to practice probability!
What's included-
*Colored candy probability activity: have students randomly pick colored candy and tally what's picked to experiment probability
*Colored candy probability activity reflection page- have students reflect on the experiment and explain their thinking
*M&M's probability activity: have students figure out how many M&M's are in a bag and what color of each by using probability
*M&M's probabil
Subjects:
Grades:
2nd - 8th
Types:
Also included in: Probability Activity BUNDLE
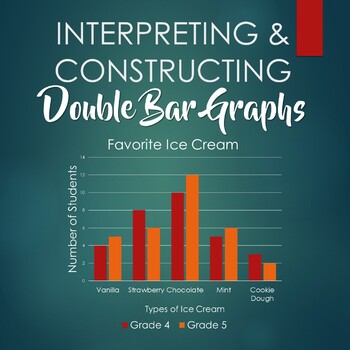
Interpreting and Constructing Double Bar Graphs - Booklet
This booklet includes six worksheets:- 3 double bar graphs for students to interpret- 3 sets of data for students to construct double bar graphs, with corresponding questions- answer key
Subjects:
Grades:
3rd - 6th
Types:
Mean Dice Math: mean, median, mode, and range
"Mean Dice" uses dice to practice calculating mean, median, mode, and range. Comes with two versions, each with a whole group introductory activity, an independent practice worksheet, and instructions for both levels of the "Mean Dice" game. Note: versions of this activity appear in EZSubPlans 4.1 and 6.1.
Subjects:
Grades:
4th - 7th
Types:
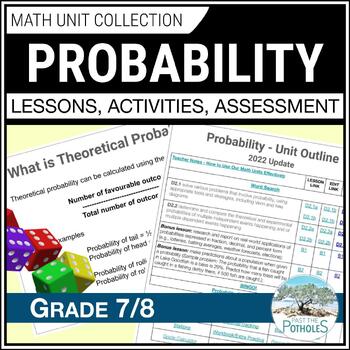
Theoretical and Experimental Probability Activities Grade 7/8 Ontario Math Unit
SAVE YOUR VALUABLE TIME! Ontario math teachers love our UPDATED Probability units! Lesson plans, centres, activities, worksheets, and assessments cover theoretical probability, experimental probability, tree diagrams and more.Our units encourage students to use and develop their Knowledge, Application, Thinking, and Communication skills in a way that will prepare them for success in the future."I have used many of the Ontario Math resources created by Past The Potholes and love them all. The Go
Subjects:
Grades:
7th - 8th
Types:

A Beautiful Mind (2001): Complete Movie Guide & Introduction to Game Theory
A Beautiful Mind is a 2001 American biographical drama film based on the life of John Nash, a Nobel Laureate in Economics. The film was directed by Ron Howard, from a screenplay written by Akiva Goldsman.These teacher-generated questions (27 in total) are designed to help students focus in on key information during the video. This movie guide also comes with an example of Game Theory (Prisoner's Dilemma) and a short reading on the history of the Nobel Prize. This guide will help your students ge
Subjects:
Grades:
9th - 12th
Types:
Box and Whisker Plots Worksheet
Hello Math Teachers! Are you looking for a fun and engaging way to teach your students about Box and Whisker Plots? Our baseball-themed worksheet is perfect for middle school and algebra classes, as well as any statistics unit.This comprehensive worksheet includes both single and double box plots, and is designed to help students progress from interpreting box plots with quartiles, interquartile range, range, and median to constructing their own box plots. The two-sided worksheet comes with an e
Subjects:
Grades:
7th - 8th
Types:
CCSS:
Also included in: Data and Statistics Worksheets Bundle
Independent & Dependent Probability Color by Number (Distance Learning)
Students of all ages love to color! Make practicing more fun with this color by number activity.Note: Using a digital color by number activity works best with iPads where coloring can be done using an app such as Notability.Students will calculate the probability of independent and dependent events. Twelve word problems are included. The focus is on learning about compound events. Specifically, students will examine the difference between independent events (with replacement) and dependent e
Subjects:
Grades:
6th - 9th
Types:
Also included in: Color by Number Bundle
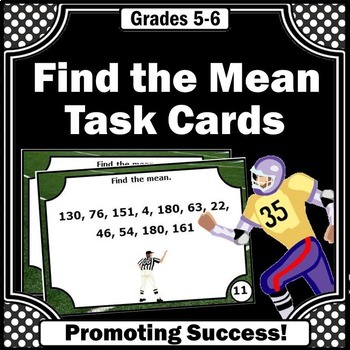
Probability and Statistics Activities Find the Mean Average of Data Task Cards
You will download 30 math task cards for your 5th and 6th grade students to practice and review finding the mean task. They work well with your measures of central tendency unit. A mean in math is the average of a data set, found by adding all numbers together and then dividing the sum of the numbers by the number of numbers.For your convenience, you will download both TPT digital EASEL and printable PDF resource formats. ☛ Please click on the PREVIEW above.You may use the printable task cards i
Subjects:
Grades:
5th - 6th
Types:
CCSS:
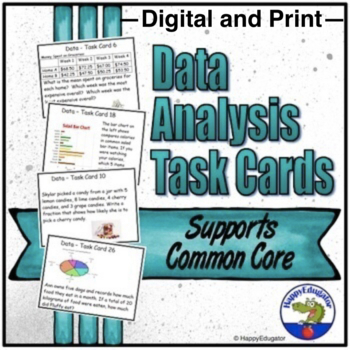
Data Analysis Task Cards Math Test Prep - Easel Activity Digital and Print
Data Analysis Task Cards. 30 task cards on data collection and data analysis, answer recording sheet, and answer key. Great for math test prep. Print or digital. Tasks includes finding range, median, mode and mean of a set of data, creating pictographs, interpreting line plots, stem and leaf plots, bar graphs, circle graphs, box and whisker plots, probability, random and biased samples.Digital and Print: Includes an Easel Activity ready for learning with digital tools. Assign it online in Googl
Subjects:
Grades:
5th - 8th
Types:
Data and Graphs Projects, 5th and 6th Grade Math Enrichment
Fun Data and Graph Enrichment Projects Students Love! Nine fun math projects that range from finding distances from cities to Olympic records and even charting calories on a super sized cheeseburger. The fun and creative projects utilize line plots, line graphs, bar graphs, double bar graphs, pie/circle graphs, mode, median, mean and range. I've also included a set of vocabulary terms, sample graphs and and a rubric! Print and go math enrichment! Perfect for distance learning as well.Please che
Subjects:
Grades:
4th - 6th
Types:
Histograms Interpreting and Creating Worksheet
Hey Math Teachers! This Histograms Worksheet is the perfect resource to help your students master constructing and interpreting histograms. This two-sided Math worksheet includes progressively challenging problems on displaying numerical data using histograms and questions on interpreting histograms. We provide scaffolding to help your students identify the components of a set of data, assess the skew of data, and report the number of observations.This worksheet is suitable for Middle School Mat
Subjects:
Grades:
6th - 9th
Types:
CCSS:
Also included in: Data and Statistics Worksheets Bundle
TEK 8.5D Making Predictions on Scatter Plots for Google Classroom™ & Boom Cards™
Are you looking for a fun activity that covers Math TEK 8.5D which is flexible enough to be a hit with your students whether you are in the classroom or teaching remotely? If that sounds like something you'd be interested in, you are going to fall in love with our super-flexible digital & printable combination task card sets. These making predictions on scatter plots digital activities are one-click away from being loaded as (1) self-graded Google Forms, (2) Google Slides, (3) Boom Cards,
Subjects:
Grades:
7th - 8th
Types:
Relative Frequency Two Way Tables by Total Row or Column Worksheet
Attention Math Teachers! Enhance your students' understanding of relative frequency tables with our Two-Way Tables Worksheet. This two-sided worksheet is designed to help students create accurate relative frequency tables from basic information given in the form of a two-way table.The worksheet focuses on completing tables when using the totals by either the row or the column equal to 1.00. By practicing this skill, students will strengthen their ability to analyze data and draw conclusions.With
Subjects:
Grades:
8th - 9th
Types:
CCSS:
Also included in: Scatterplots Two Way Tables and Residual Plots Worksheets Bundle
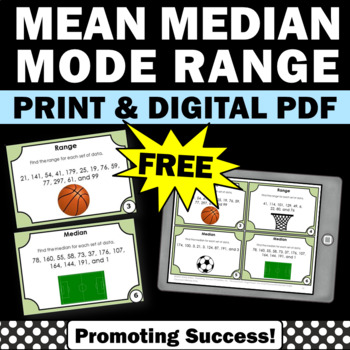
FREE Statistics and Probability Mean Median Mode Range Task Cards 5th 6th Grade
DIGITAL PDF AND PRINTABLES: You will download six free mean, median, mode and range task cards for your 5th or 6th grade students to practice finding the mean, median, mode and range. You may use the printable task cards in math centers or stations for fun review games and activities, such as a scavenger hunt or SCOOT. They also work well for transition activities, as exit tickets and for morning work, quick formative assessments. Game ideas, a student response form and answer key are included.✔
Subjects:
Grades:
5th - 6th
Types:
CCSS:
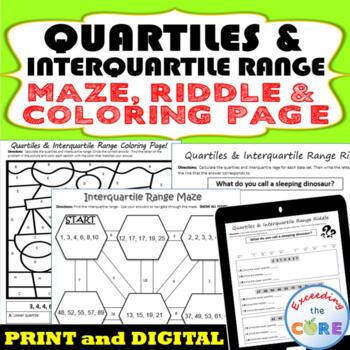
QUARTILES & INTERQUARTILE RANGE Maze, Riddle, Coloring Page | PRINT & DIGITAL
Have your students practice finding the QUARTILES, MEDIAN AND INTERQUARTILE RANGE of a data set with these fun activities including a maze, riddle, and coloring activity. What's Included:1. Quartiles and Interquartile Range COLORING ACTIVITY Students are prompted to find the first quartile, median, third quartile, and interquartile range (IQR) . Students use their solutions to color the picture. 2. Interquartile Range MAZEThis is a self-checking worksheet that allows students to strengthen thei
Subjects:
Grades:
6th - 8th
Types:
Also included in: 7th GRADE MATH Assessments, Warm-Ups, Task Cards, Worksheets BUNDLE
TEK 7.6I Theoretical & Experimental Probability Google Classroom™ & Boom Cards™
Are you looking for a fun activity that covers Math TEK 7.6I which is flexible enough to be a hit with your students whether you are in the classroom or teaching remotely? If that sounds like something you'd be interested in, you are going to fall in love with our super-flexible digital & printable combination task card sets. These theoretical and experimental probability digital activities are one-click away from being loaded as (1) self-graded Google Forms™, (2) Google Slides™, (3) Boom
Subjects:
Grades:
6th - 7th
Types:
Line of Best Fit Practice Worksheet
Hello Math Teachers! Are you looking for a fun and engaging way for your students to practice their scatterplot skills? Check out this worksheet that focuses on eyeballing the line of best fit and estimating the correct equation that corresponds with it.With this two-sided worksheet, students will have the opportunity to practice using scatterplots and make the connection to the fit of a linear function. The scaffolding includes matching equations to the line of best fit (regression line), which
Subjects:
Grades:
8th
Types:
CCSS:
Also included in: Scatterplots Two Way Tables and Residual Plots Worksheets Bundle
Showing 1-24 of 146 results


