7,543 results
High school statistics resources for homeschool under $5
Mean, Median, Mode & Range Whodunnit Activity - Printable & Digital Game Options
Nothing like a good criminal investigation to liven up mean, median, mode, and range! Based off my popular CSI projects, I have created Whodunnits? The Whodunnits plan to focus on single content topics as opposed to units and will focus more on skill building than application. Every day can't be a project day, so Whodunnits can be an engaging out of their seat activity to practice important skills. In a Whodunnit?, students will work in teams to solve 10 practice problems that increase in diffic
Subjects:
Grades:
6th - 12th
Types:
Also included in: Pre-Algebra Whodunnit Activity Bundle - Printable & Digital Game Options
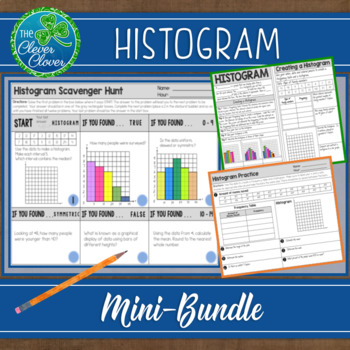
Histogram - Notes, Practice Worksheets and Scavenger Hunt
This histogram resource includes guided notes, a practice worksheet and a scavenger hunt. Your students will have the opportunity to create, interpret and discuss histograms. Below, you will find a detailed description of the notes, worksheet and scavenger hunt. Guided NotesThere are two small pages of guided notes. The first page provides the definition of a histogram and step by step instructions on how to create a histogram. The bottom portion of the notes has students examine three types (un
Subjects:
Grades:
6th - 9th, Adult Education
CCSS:
Also included in: Statistics Bundle - Guided Notes, Worksheets & Scavenger Hunts!
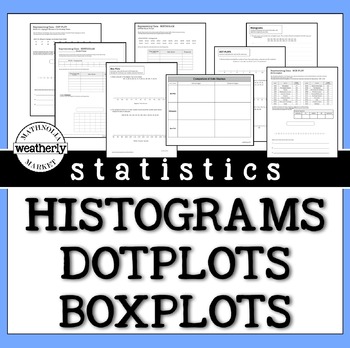
STATISTICS - Histograms, Dot Plots and Box Plots
There is no need to scour the internet for data. This resource includes the data and the format to challenge your students' skills with data displays.This packet includes worksheets that provide opportunities for students to create histograms, dot plots, and box plots.They can be used as guided practice or as "on your own" activities.INCLUDES3 worksheets with realistic data.3 worksheets with REAL data (Apple stock prices, US Olympic athlete ages, and the Oscars:Best Picture/ Movie Times)AND 3 wo
Subjects:
Grades:
6th - 9th
Types:
CCSS:
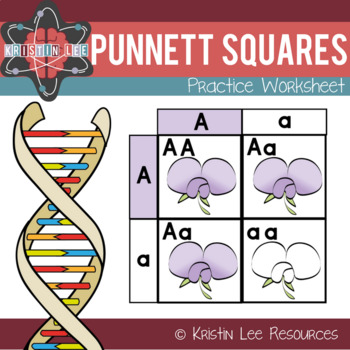
Punnett Squares Practice Worksheet
This is a worksheet I used with my 7th graders during a Genetics unit. We had just gone over probability and Punnett Squares. This was the first practice that they had to do on their own. Background knowledge required. The worksheet consists of filling in Punnett squares and using them to determine the probabilities of different traits. There are 5 problems and 2 conclusion questions.This worksheet also comes with the bundle "Probability in Genetics PPT w/ Notes and Punnett Worksheet" if you
Subjects:
Grades:
6th - 8th
Types:
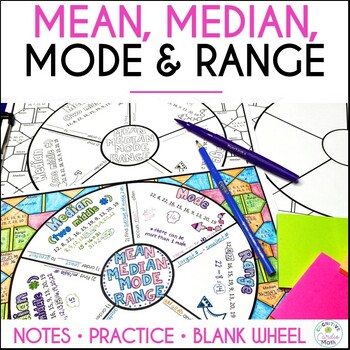
Mean, Median, Mode, Range Math Doodle Wheel | Notes and Practice Activity
Use this mean, median, mode, range doodle math wheel for notes and practice. Introduce each data measurement type as you teach it, or, you can use the math wheel to review all of them at once.What is a math wheel? A math wheel is a type of graphic organizer where students can:Take notes/guided notes inside the math wheelUse color, drawing, and doodling to help create memory triggersComplete practice problems in the pattern around the wheel, andColor the background patternStudents can keep these
Subjects:
Grades:
4th - 6th
Also included in: Mean, Median, Mode, Range Activity Bundle Math Centers
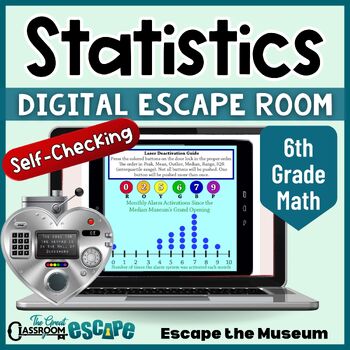
6th Grade Math Data Analysis & Statistics Activity Digital Escape Room Game
Find the median, read the box plot, interpret the frequency table, and unlock the door! This 6th grade math activity based on statistics and probability standards will put your students statistical skills to the test. Your students are volunteer docents at the Median Museum. After the security system locks everyone in, they will need to use their knowledge of statistics to escape the museum. This engaging digital escape room is easy for teachers to implement. The breakout process is fully autom
Subjects:
Grades:
6th - 7th
Types:
Deal or No Deal Probability Game for Grades 6 and up
Play a game while learning---what more can a student want? Introduce this take on a popular television game show, Deal or No Deal, to get your students engaged in the study of probability. This pack includes:Directions for contestant/bankerGame sheets for contestant/bankerBrief cases 1-25 (laminate these for durability)Brief cases for $.01-$1,000,000 (laminate these for durability)You may also want to put velcro on the back to make it easier to play and switch cases!Leave feedback and comments
Subjects:
Grades:
6th - 12th
Intro to Probability Whodunnit Activity - Printable & Digital Game Options
Nothing like a good criminal investigation to liven up probability! Based off my popular CSI projects, I have created Whodunnits? The Whodunnits plan to focus on single content topics as opposed to units and will focus more on skill building than application. Every day can't be a project day, so Whodunnits can be an engaging out of their seat activity to practice important skills. In a Whodunnit?, students will work in teams to solve 10 practice problems that increase in difficult. After each an
Subjects:
Grades:
7th - 10th
Types:
Also included in: Probability & Expected Value Unit Bundle - Distance Learning Compatible
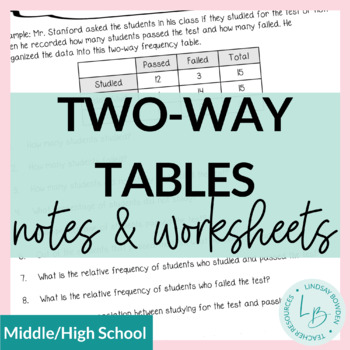
Two-Way Frequency Tables Notes and Worksheets
These two-way frequency table notes and worksheets are meant for an Algebra 1 statistics unit. However, they can also be used in middle school. They cover:Reading two-way frequency tablesFinding joint, marginal, and conditional relative frequenciesCreating two-way frequency tablesSee preview to view all pages! 4 pages + answer keys.You may also like:Two-Way Frequency Tables Task CardsBox and Whisker Plots Notes & WorksheetsHistograms Notes & WorksheetsTerms of Use:This product should onl
Subjects:
Grades:
8th - 10th
CCSS:
Also included in: Statistics Unit Bundle
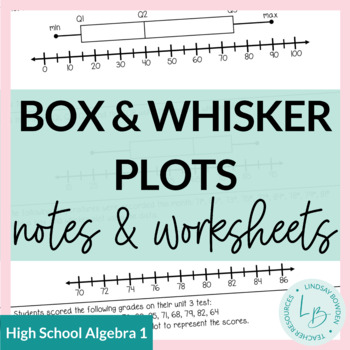
Box and Whisker Plots Notes and Worksheets
These notes and worksheets cover:RangeQuartiles and Interquartile RangeBox and Whisker PlotsIncludes 2 pages of notes and 2 worksheets. Answer keys included! These are meant for an Algebra 1 class, but can also be used for middle school (Texas standards for 7th grade). You may also like:Mean, Median, and Mode Notes & WorksheetsHistograms Notes & WorksheetsComparing Data: Spread, Shape, and Center Notes & WorksheetsTerms of Use:This product should only be used by the teacher who purch
Subjects:
Grades:
8th - 10th
CCSS:
Also included in: Statistics Unit Bundle
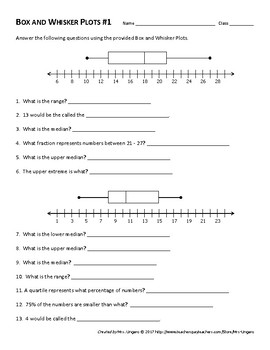
Box and Whisker Plot Worksheets
This product contains TWO Box-and-Whisker Plot worksheets.
Both worksheets requires students to read, interpret, and create Box-and-Whisker plots. Students will first be asked to find lower and upper extremes, range, and all three medians. Following this, students will be creating their own Box-and-Whisker Plots using the information provided.
Worksheet #1 is slightly easier than worksheet #2. This can be used to cover multiple days of instruction or to differentiate within the classroom.
Subjects:
Grades:
5th - 8th
Types:
CCSS:

Box and Whisker Plots Whodunnit Activity - Printable & Digital Game Options
Nothing like a good criminal investigation to liven up box and whisker plots! Based off my popular CSI projects, I have created Whodunnits? The Whodunnits plan to focus on single content topics as opposed to units and will focus more on skill building than application. Every day can't be a project day, so Whodunnits can be an engaging out of their seat activity to practice important skills. In a Whodunnit?, students will work in teams to solve 10 practice problems that increase in difficult. Aft
Subjects:
Grades:
7th - 12th
Types:
CCSS:
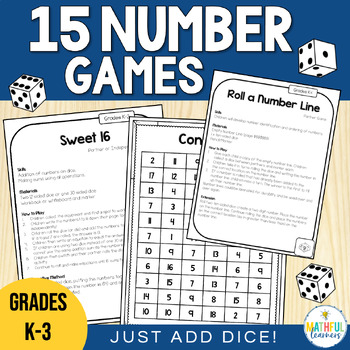
Dice Math Games - 15 Printable Number Centres - K to 3
Playing these Dice Number Games will keep your students engaged and eager to learn more during your next math centers. Including 15 number games, these printable dice games can easily be used as your warm up activity or as a complete math lesson. Your students will practice basic math skills all while having FUN. Most games can be played over and over again in your Grade K-3 classroom! All resources are provided, simply read and copy off game boards as required, and JUST ADD DICE! In search of
Subjects:
Grades:
K - 3rd
Types:
Probability of Compound Events Whodunnit Activity - Printable & Digital Game
Nothing like a good criminal investigation to liven up probabilities of compound events! Based off my popular CSI projects, I have created Whodunnits? The Whodunnits plan to focus on single content topics as opposed to units and will focus more on skill building than application. Every day can't be a project day, so Whodunnits can be an engaging out of their seat activity to practice important skills. In a Whodunnit?, students will work in teams to solve 10 practice problems that increase in dif
Subjects:
Grades:
7th - 12th
Types:
Also included in: Probability & Expected Value Unit Bundle - Distance Learning Compatible
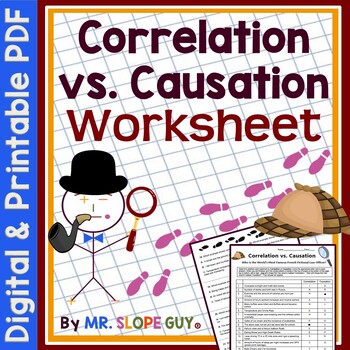
Correlation vs Causation Worksheet
Hello Math Teachers! Help your math students understand the difference between correlation and causation with our fun activity worksheet. Students will evaluate 42 statements and determine whether they demonstrate correlation or causation, and there are some multiple-choice questions as well. This activity also includes a puzzle that generates an answer, making it easy to grade.This two-sided worksheet is great for classwork or homework and is designed to help students develop critical thinking
Subjects:
Grades:
9th
Types:
CCSS:
Also included in: Algebra Math Riddle Worksheets
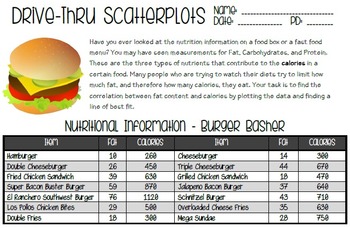
Drivethru Scatter Plots - Line of Best Fit Activity
This activity is a fun way to work with scatter plots in a realistic situation. Students will compare the fat and calories in items from a fictional fast food restaurant by creating a scatter plot. They will also draw a line of best fit, approximate the slope of that line, and make predictions based on the line.
Included:
*Drive-Thru Scatterplots Activity
*Answer Key
Please leave feedback with any suggestions for improvements! :)
Subjects:
Grades:
8th - 9th
Types:
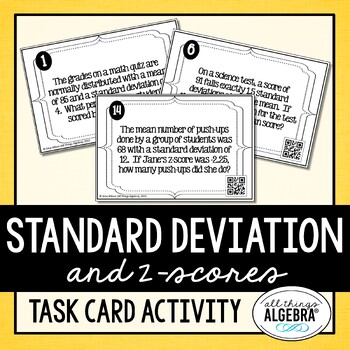
Normal Distribution, Standard Deviation, Z-Scores | Task Cards
Normal Distribution, Standard Deviation, Z-Scores Task CardsStudents will practice calculating and interpreting z-scores, normal distribution, and standard deviation in real world contexts by working through these 20 task cards. These are challenging and diverse questions that require students to read carefully. They can check their answers by scanning the QR code on each card. Connection to the internet is not required to scan the code. However, a QR scanner app is required on the device.
Subjects:
Grades:
8th - 12th
Types:
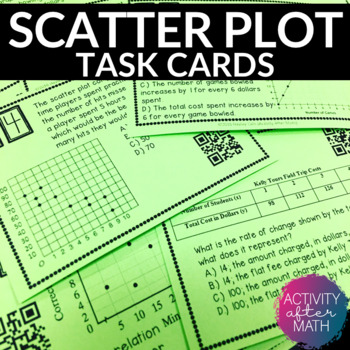
Scatter Plots and Line of Best Fit Task Cards with QR Codes
Get your students involved with practicing Interpreting Data with Scatter Plots and Line of Best Fit! Task cards include multiple choice problems and constructed response. Click here to SAVE and get this as a Task Cards BUNDLEThis resource includes:Teacher InstructionsTeacher TipsStudent Instructions24 Task cards with QR codes24 Task cards without QR codesBlank Answer Document for studentsAnswer Key for easy gradingOptions for using this resource:You can print the ones with QR codes for students
Subjects:
Grades:
8th - 9th
Types:
Also included in: 8th Grade MATH TASK CARDS BUNDLE
Theoretical and Experimental Probability M&M activity
Students need to find the probability of picking certain colored M&Ms, and asked to change them into decimals, fractions, and percents. They are asked to draw specific M&Ms at random for experimental probability problems. They are asked to make a few predictions, as well. This is a lengthy lesson and takes a while to get through, so make sure you have enough time to get through it. It can be done in 2 days, and if you need to use colored chips or counters instead, go for it!
Subjects:
Grades:
5th - 11th
Types:

Stem and Leaf Plots Whodunnit Activity - Printable & Digital Game Options
Nothing like a good criminal investigation to liven up stem and leaf plots! Based off my popular CSI projects, I have created Whodunnits? The Whodunnits plan to focus on single content topics as opposed to units and will focus more on skill building than application. Every day can't be a project day, so Whodunnits can be an engaging out of their seat activity to practice important skills. In a Whodunnit?, students will work in teams to solve 10 practice problems that increase in difficult. After
Subjects:
Grades:
5th - 10th
Types:
CCSS:
Also included in: Pre-Algebra Whodunnit Activity Bundle - Printable & Digital Game Options
Two Way Relative Frequency Tables Worksheet
Are you a math teacher looking for engaging classwork or homework activities to help your students with relative frequency tables? Look no further! Our worksheet on completing two-way tables and creating relative frequency tables is perfect for your needs. Great for Pre-Algebra and Algebra 1 students. With real-world situations and comprehension questions based on relative frequency tables, students will learn to summarize and interpret data collected from the same subjects. They'll construct an
Subjects:
Grades:
8th - 9th
Types:
CCSS:
Also included in: Scatterplots Two Way Tables and Residual Plots Worksheets Bundle
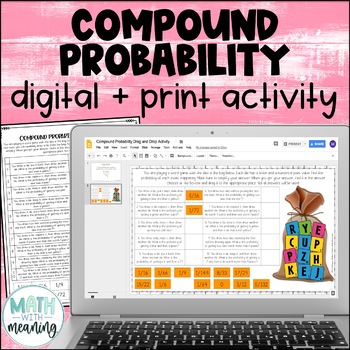
Compound Probability Digital and Print Activity for Google Drive and OneDrive
Looking for an engaging, no-prep activity to practice finding the probability of compound events? Students will use the included image to find the probability of 10 compound events, including both independent and dependent events. They will then find their answer from the answer choices at the bottom and drag it to the appropriate spot. Please view the preview file to make sure that this activity is appropriate for your students.This product includes the following:A link to the digital activity
Subjects:
Grades:
6th - 9th
CCSS:
Also included in: Middle School Math Digital and Print Activity Bundle Volume 1
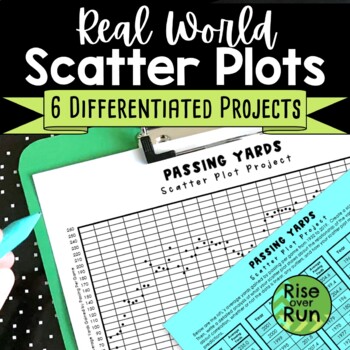
Scatter Plot Project with Real World Sports Data
Practice creating and analyzing scatter plots with these six differentiated real world projects. Students are provided statistics for a sport and must graph the data. Then, they write an analysis describing correlation, whether or not the data is linear, any outliers, and how the scatter plot might be used to make predictions. The scatterplots range from 38 points to 149 points, so they can be used to differentiate. The scatter plots will take a little time to plot, but they result in real
Subjects:
Grades:
8th - 9th
Types:
CCSS:
Also included in: 8th Grade Math Activities & Lessons Bundle for the Whole Year
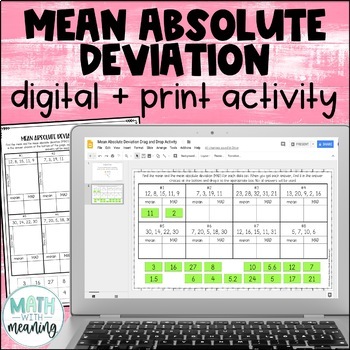
Mean Absolute Deviation MAD Digital and Print Activity for Google Drive
Looking for an engaging, no-prep activity to practice finding the MAD? Students will find the mean and mean absolute deviation for 8 data sets. They will then then find their answer from the answer choices at the bottom and drag it to the appropriate spot. Each data set contains 4-5 numbers. The mean of each data set is a whole number. Please view the preview file to make sure that these types of problems are appropriate for your students.This product includes the following:A link to the activit
Subjects:
Grades:
6th - 9th
CCSS:
Also included in: Middle School Math Digital and Print Activity Bundle Volume 2
Showing 1-24 of 7,543 results


