117 results
7th grade graphing printables for Microsoft PowerPoint

Coordinate Grid Quadrant 1 Bundle
This bundle deals mostly with quadrant one of the coordinate plane.The resources include:Free Blank coordinate planes/coordinate grids in printable and digital formatsIntroduction to Coordinate Graphing PowerPointPrintable & Digital Coordinate Plane Quadrant 1 WorksheetsCoordinate Plane Quadrant 1 Boom CardsBuy these in the bundle to get them at 30% off!*While the title says "Quadrant 1 Bundle," the printable worksheets include one page on quadrants 1-4 and the digital worksheets include thr
Grades:
5th - 7th
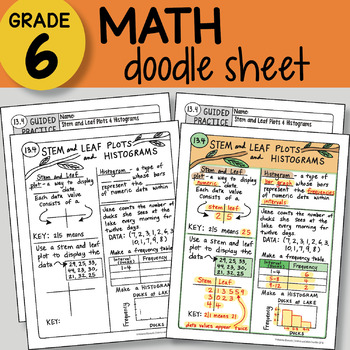
Math Doodle - Stem and Leaf Plots & Histograms - EASY to Use Notes - PPT!
INCLUDED in this download:Math Doodle SheetGuided Practice Sheet PowerPoint – to show students the KEY– two versions of both sheets included: INB and large 8.5 x 11 sizeTEKS and CC Aligned – plan for the FULL year includedThis download is part of a larger bundle of 68 Doodle Sheets found here: 6th Grade Math ALL the DOODLE Sheets ~ So Fun and Engaging!These 6th grade math doodle sheets are a great way to help the students learn math concepts! Students are engaged as they take creative notes and
Subjects:
Grades:
5th - 7th
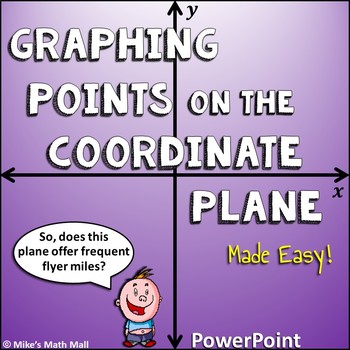
Graph Points on the Coordinate Plane (PowerPoint Only) - Distance Learning
This is an awesome PowerPoint that will have your kids accurately graphing points on the coordinate plane in no time.PowerPointThe entertaining, interactive, and easy-to-understand 17-slide PowerPoint walks learners through:-The development of the coordinate plane-Basic graphing and coordinate plane terminology: x-axis, y-axis, ordered pair, coordinates, origin, quadrant, etc.-Plotting point demonstrations-Various plotting points practice (three slides)These embedded practice problems are essent
Subjects:
Grades:
5th - 7th
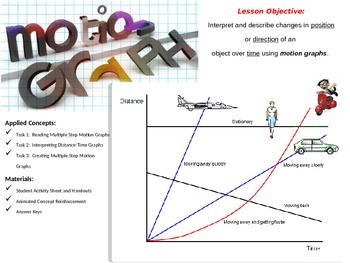
Motion Graphs
Lesson Objective:
Interpret and describe changes in position or direction of an object over time using motion graphs.
Types of Graphs Included in Lesson:
Distance/Time
Position/Time
Applied Concepts:
Task 1: Reading Multiple Step Motion Graphs
Task 2: Interpreting Distance-Time Graphs
Task 3: Creating Multiple Step Motion Graphs
Materials:
Student Activity Sheet and Handouts
Animated Concept Reinforcement
Answer Keys
*This lesson is not intended to be used as an introduction to Distanc
Subjects:
Grades:
6th - 8th
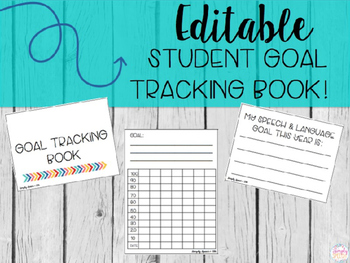
Editable Student Goal Tracking Book
These mini goal books are the perfect way to help your students keep track of their own goals. These books help increase student motivation and self awareness as they create their own personal goals and track their own progress.Here's what's included:Page 3: cover page options. This page is editable. Click on 'add text box' to add your students' names to their books.Page 4: Goal tracking sheets. Print as many of these pages as you need. This is also editable if you wish to type the goals in. Pag
Subjects:
Grades:
1st - 12th
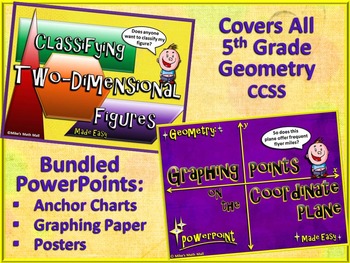
5th Grade Geometry CCSS (Bundled PowerPoint Pack)
5th Grade Geometry - These are fun, very interactive PowerPoints that will help your students understand how to graph points on the coordinate plane and classify two-dimensional figures (polygons, triangles, quadrilaterals, etc.).PowerPoint #1 - Classifying Two-Dimensional Figures (20 slides):-Orientation/Vocabulary/Introduction to Polygons-Classifying Triangles (acute, right, obtuse, isosceles, equilateral, and scalene)-Classifying Quadrilaterals (regular and irregular, trapezoids, parallelogr
Grades:
4th - 7th
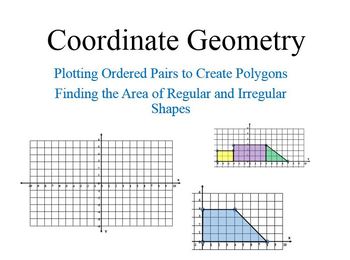
Coordinate Geometry and Finding Area by Decomposing Shapes
This product targets three Common Core standards. The main lesson includes 12 problems. Students plot and connect points on the coordinate axes. Then students find the area of the shapes they create. The lesson has a nice progression from simple rectangles and triangles to irregular polygons that must be decomposed into rectangles and triangles.
If you are looking for a lesson that combines many skills, then this is a great resource for you. Students plot ordered pairs in all 4 quadrants.
Subjects:
Grades:
6th - 7th

Stars and Constellations PowerPoint & Coordinate Plane Graphing Pictures Bundle
This Bundle includes:Graphing the Constellations: Coordinate Graphing - My Best SellerThis activity integrates Math and Science by teaching students about coordinate graphing as well as the constellations! The constellations are precisely positioned so that their positions match that of their actual positions in the sky! This can even be used as a constellation star map!Stars and Constellations PowerPoint: Galaxies, Nebulas, and Greek MythologyStop getting lost looking for stars & constellat
Subjects:
Grades:
4th - 9th
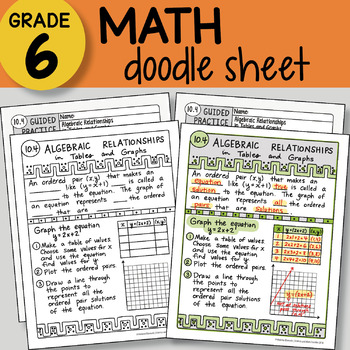
Math Doodle - Algebraic Relationships in Tables and Graphs - EASY to Use Notes
INCLUDED in this download:Math Doodle SheetGuided Practice Sheet PowerPoint – to show students the KEY– two versions of both sheets included: INB and large 8.5 x 11 sizeTEKS and CC Aligned – plan for the FULL year includedThis download is part of a larger bundle of 68 Doodle Sheets found here: 6th Grade Math ALL the DOODLE Sheets ~ So Fun and Engaging!These 6th grade math doodle sheets are a great way to help the students learn math concepts! Students are engaged as they take creative notes and
Grades:
5th - 7th
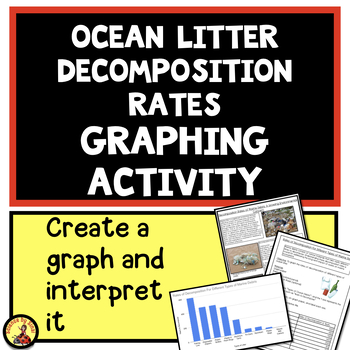
Graphing Marine Litter Decomposition Data Interpretation Middle School Practice
Graphing activity with reading passage. Learn to interpret data, create intervals, labels and plot points on graph paper and later on a computer. The real world data involves looking the rates of decomposition for different types of ocean litter or marine debris. Students read a three page passage about marine litter and decomposition and then draw a bar graph. They answer questions about trends they see about the relationship between food products and Phosphate runoff. No prep. Great for indep
Subjects:
Grades:
5th - 8th
Types:
NGSS:
MS-LS2-4
, MS-LS2-1
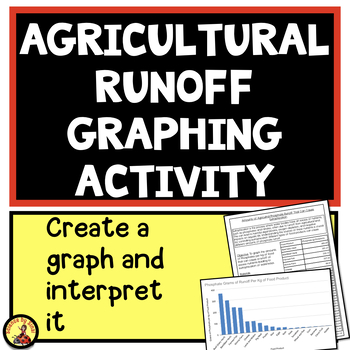
Graphing Agricultural Run Off Data Interpretation Middle School Practice Reading
Graphing activity with reading passage. Learn to interpret data, create intervals, labels and plot points on graph paper and later on a computer. The real world data involves looking at the levels of agricultural Phosphate runoff, caused by a variety of different food products, that can cause eutrophication in local waterways. Students read a two page passage about eutrophication and then draw a bar graph. They answer questions about trends they see about the relationship between food products a
Subjects:
Grades:
5th - 8th
Types:
NGSS:
MS-LS2-4
, MS-LS2-1
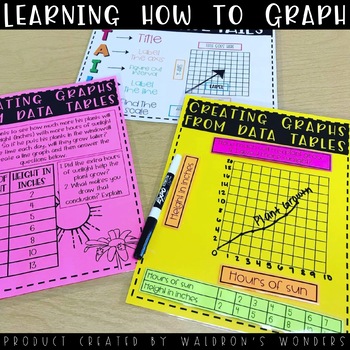
Learning How to Graph
In this product you will find:-How to graph power point to go over the TAILS graphing procedure-Printable 8.5x11 posters for the students to use as a reference to use TAILS-A cut out of TAILS for their interactive notebooks-Creating graphs from word problems and data tables practice (6 different full page printables)-Creating graphs from data tables printables manipulatives (cut and glue/velcro/magnets etc. See product pictures for how I made them with Velcro!-Independent practice (could be a qu
Subjects:
Grades:
4th - 12th
Types:
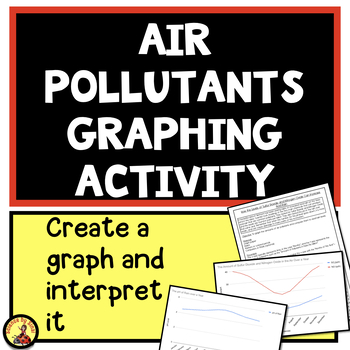
Graphing Air Pollutants and Acid Rain Data Interpretation Middle School Practice
Learn to interpret data, create intervals, labels and plot points on graph paper and later on a computer. The data involves looking at the levels of Sulfur Dioxide and Nitrogen Oxide, over a year, and comparing them to acid rain pH levels over the same time. Students draw two line graphs and then answer questions about trends they see about the relationship between air pollutants and the pH of acid rain. No prep. Great for independent work or a sub activity!Included in this resource:Teacher Note
Subjects:
Grades:
5th - 7th
Types:
NGSS:
MS-LS2-4
, MS-LS2-1
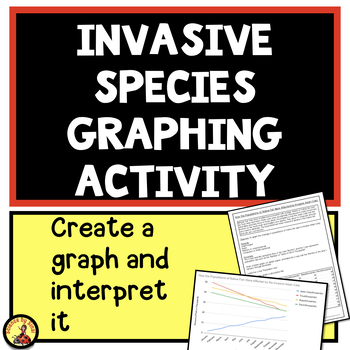
Graphing Invasive Species Asian Carp Data Interpretation Middle School Practice
Learn to interpret data, create intervals, labels and plot points on graph paper and later on a computer. The data involves analyzing the impact of invasive Asian Carp on native fish species. Students draw their graph and then answer questions about trends they see about the changes in populations of Trout, Bass and Perch. No prep. Great for independent work or a sub activity!Included in this resource:Teacher NotesStudent Instructions for graphing on paper and computer QuestionsAnswersECOLOGY UN
Subjects:
Grades:
5th - 7th
Types:
NGSS:
MS-LS2-4
, MS-LS2-1
Graphing Plastic Litter Types Data Interpretation Middle School Practice Review
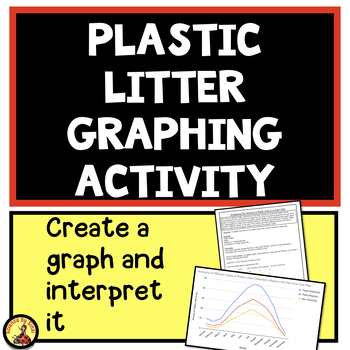
Learn to interpret data, create intervals, labels and plot points on graph paper and later on a computer. The data involves analyzing plastic litter in a small town park over a year’s time. Students draw their graph and then answer questions about trends they see about the amount, type of litter and time of year. No prep. Great for independent work or a sub activity!Included in this resource:Teacher NotesStudent Instructions for graphing on paper and computer QuestionsAnswersECOLOGY UNIT BUNDLE
Subjects:
Grades:
5th - 7th
Types:
NGSS:
MS-LS2-4
, MS-LS2-1
Graphing Predator Prey Relationship Data Interpretation Middle School Practice
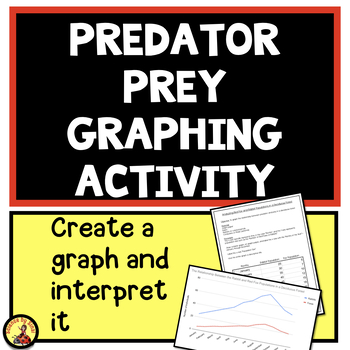
Learn to interpret data, create intervals, labels and plot points on graph paper and later on a computer. The data involves the predator prey relationship between rabbits and foxes in a deciduous forest. Students draw their graph and then answer questions about trends they see between the two populations and time of year. No prep. Great for independent work or a sub activity!Included in this resource:Teacher NotesStudent Instructions for graphing on paper and computer QuestionsAnswersECOLOGY UNI
Subjects:
Grades:
5th - 7th
Types:
NGSS:
MS-LS2-4
, MS-LS2-1

Finding Slope from a Proportional Graph Math Practice Activity
Need an engaging NO-PREP math activity for finding slope from a proportional graph? This activity has two engaging ways to practice identifying slope from proportional graphs.TWO Versions:→ Tricky Pick→ True or DareTricky Pick provides student choice. Students must first decide how they would like to complete the practice: alone, with a partner, or with teacher assistance, but picking is tricky. If they choose to work with a partner, the partner must choose a dare for them to complete while work
Grades:
6th - 8th
Types:
Finding the Slope and Y-Intercept of a Linear Equation Polka Dots Matching Game
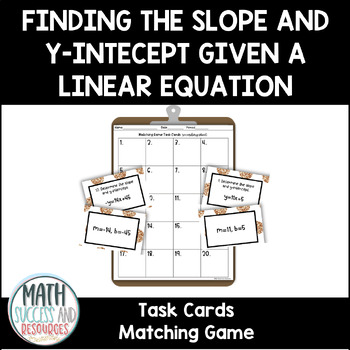
Have you been looking for a fun and educational way to engage your students and help them explore finding the slope and y-intercept of a linear equation? This self-checking polka dot themed matching game activity is just what your need! Students will work through 20 different problems to find their correct matches. This activity can be used for grades 7,8, and 9. My students love playing engaging matching games and competing against one another.Color and black and white versions are included to
Grades:
7th - 9th
Types:

Writing Equations in Slope-Intercept Form End of the Year Math Coloring Activity
Have you been looking for a fun and educational way to engage your students and help them explore writing equations in slope-intercept form given the slope and y-intercept? This self-checking summer themed color-by-number activity is just what your need!This print and go resource can be used for Algebra and grades 7,8 and 9. Students will use their answers to find the color. They will then use the color on the corresponding numbers on the pictures. This is a PowerPoint format. It includes 4 pag
Subjects:
Grades:
7th - 9th
Types:
Scatter Plots PowerPoint and Guided Notes
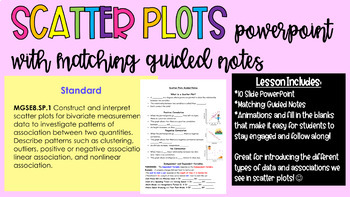
This product includes a PowerPoint Presentation with animations that go along with matching guided notes. It is a great way to ensure students are engaged and focused within the lesson. Also will take some of the stress of getting all of the notes down and make the content less overwhelming to the students. This lesson covers the 8th grade Common Core Standard: MGSE8.SP.1 Construct and interpret scatter plots for bivariate measurement data to investigate patterns of association between two q
Grades:
6th - 8th
CCSS:

Finding the Slope of a Line Given Two Points Back to School Coloring Activity
Have you been looking for a fun and educational way to engage your students and help them explore finding the slope of a line given two points? This self-checking Back to School themed color-by-number activity are just what your need!This print and go resource can be used for Algebra and grades 7,8 and 9. Students will use their answers to find the color. They will then use the color on the corresponding numbers on the pictures. This is a PowerPoint format. It includes 4 pages: the worksheet, t
Subjects:
Grades:
7th - 9th
Types:
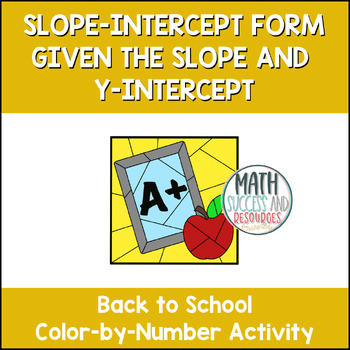
Writing Equations in Slope-Intercept Form Back to School Math Coloring Activity
Have you been looking for a fun and educational way to engage your students and help them explore writing equations in slope-intercept form given the slope and y-intercept? This self-checking Back to School themed color-by-number activity is just what your need!This print and go resource can be used for Algebra and grades 7,8 and 9. Students will use their answers to find the color. They will then use the color on the corresponding numbers on the pictures. This is a PowerPoint format. It includ
Subjects:
Grades:
7th - 9th
Types:
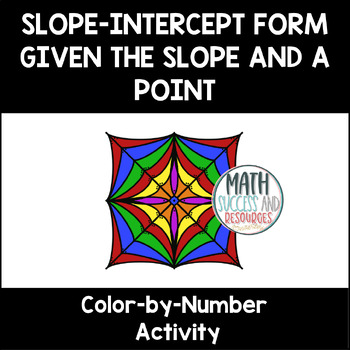
Slope-Intercept Form Given a Point and the Slope Color-by-Number Activity
Have you been looking for a fun and educational way to engage your students and help them explore writing equations in slope-intercept form given the slope and a point? This self-checking mandala themed color-by-number activity is just what your need!This print and go resource can be used for Algebra and grades 7,8 and 9. Students will use their answers to find the color. They will then use the color on the corresponding numbers on the pictures. This is a PowerPoint format. It includes 4 pages:
Grades:
7th - 9th
Types:
Also included in: Slope Given Two Points and Slope-Intercept Form Mandala Math Activities

Finding the Slope of a Line Given Two Points Mandala Math Coloring Activity
Have you been looking for a fun and educational way to engage your students and help them explore finding the slope of a line given two points? This self-checking mandala themed color-by-number activity are just what your need!This print and go resource can be used for Algebra and grades 7,8 and 9. Students will use their answers to find the color. They will then use the color on the corresponding numbers on the pictures. This is a PowerPoint format. It includes 4 pages: the worksheet, the colo
Grades:
7th - 9th
Types:
Also included in: Slope Given Two Points and Slope-Intercept Form Mandala Math Activities
Showing 1-24 of 117 results


