2 results
Statistics Common Core 2.MD.D.10 resources for Microsoft Excel

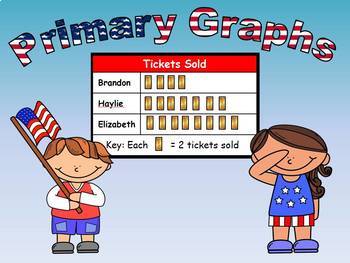
Primary Graphs Unit (Line Plot, Bar, Pictograph, Pie, and Line)
This compressed files contains all the materials you need to teach your primary students about graphing 7 different data surveys as line plots, bar graphs, or pictographs. Inside the folder is a PowerPoint presentation to teach the concepts as your students complete each of the 7 graphs. (There is also an equivalent SmartBoard Notebook presentation of the same lesson)• CCSS.Math.Content.1.MD.C.4• CCSS.Math.Content.2.MD.D.10Also included is an Excel spreadsheet that will show your primary student
Subjects:
Grades:
K - 2nd

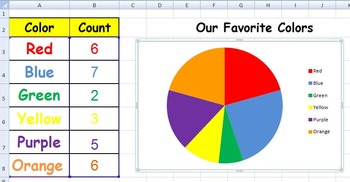
Graph Our Favorite Colors
This Excel spreadsheet will show your primary students the same data in a pie graph, a bar graph, and a line graph. You just need to survey your students about their favorite color and input the numbers into the graph. (When you first look at the graph, no data will be shown.)This spreadsheet offers more graphs:Primary Graphs Unit
Subjects:
Grades:
K - 2nd
Showing 1-2 of 2 results


