3 results
Graphing Common Core 2.MD.D.10 resources for Microsoft Excel

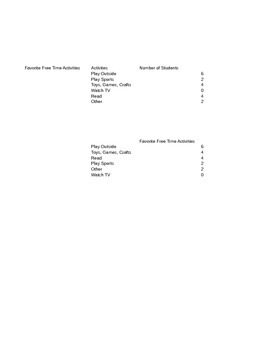
Favorite Hobby/Free Time Real-Time Interactive Bar and Pie Graph
Take a live poll and show your students how the data input changes the bar and pie graph. Easily modified to fit many classrooms by simply changing the names of the hobbies or change the topic altogether.
Subjects:
Grades:
K - 3rd

Differentiated CCSS Progress Monitoring Template - 2nd Grade MD
This document contains record keeping templates for each Measurement and Data CCSS standard at the second grade level. It connects standards for remediation and standards for acceleration that align with the focus standard, therefore allowing teachers to track student progress along a logical continuum. This tool can be used for differentiation, RTI goal setting, and daily progress-monitoring.
On each page, the bolded standard is the focus standard - the one that you are currently teaching and
Subjects:
Grades:
2nd
Types:

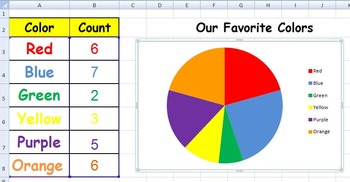
Graph Our Favorite Colors
This Excel spreadsheet will show your primary students the same data in a pie graph, a bar graph, and a line graph. You just need to survey your students about their favorite color and input the numbers into the graph. (When you first look at the graph, no data will be shown.)This spreadsheet offers more graphs:Primary Graphs Unit
Subjects:
Grades:
K - 2nd
Showing 1-3 of 3 results


