14 results
Graphing Common Core RST.6-8.1 resources
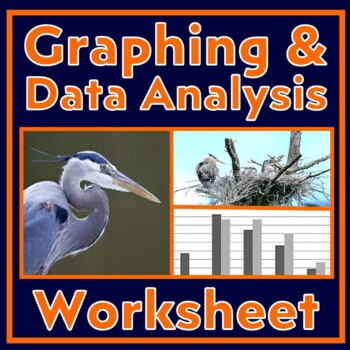
Data Analysis and Graphing Worksheet Scientific Method Practice (Herons)
Students build GRAPHING and DATA ANALYSIS skills. This activity provides a data table and an incomplete bar graph related to nesting habits of herons. Students follow directions that lead them through foundational graphing and data analysis skills. Instruction is built into the worksheet. This activity builds the following skills:Setting up bar graphs, including choosing intervals, labeling axes, and writing graph titles.Using data to make a bar graph (with an example already in place).Pulling
Subjects:
Grades:
6th - 9th
CCSS:
NGSS:
MS-LS2-2
, MS-LS2-1
, HS-LS2-1
, HS-LS2-2
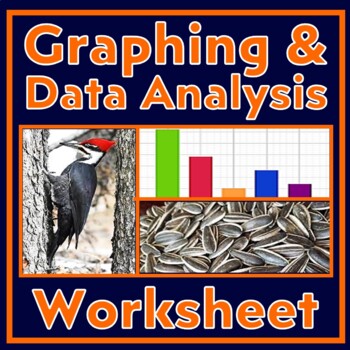
Graphing and Analyzing Data Activity with Scientific Method (Woodpeckers)
Use this data analysis and graphing worksheet to build GRAPHING and DATA ANALYSIS skills. This worksheet provides a data table from an experiment designed to find out which food woodpeckers prefer. Students follow directions that lead them through foundational graphing and data analysis skills, including making a bar graph and then analyzing it. Instruction is built into the worksheet. Students will practice the following skills in this activity:Setting up bar graphs, including choosing inter
Subjects:
Grades:
7th - 10th
CCSS:
NGSS:
MS-LS2-2
, MS-LS2-4
, HS-LS2-2
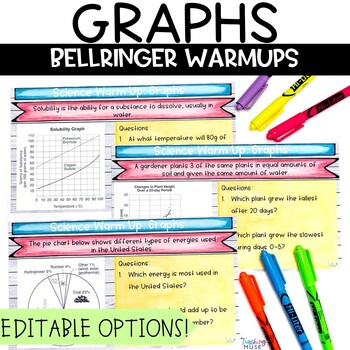
Bell Ringer Graphing in Science
Do your students need practice reading and understanding graphs? Add this bellringer to your science classroom routine this back to school season. The 20 graphs will help students warm up their science skills to analyze, interpret, and demonstrate their understanding of graphing. The graphs include an editable option to allow you to write questions specific to your classroom. This activity includes circle graphs, bar graphs, line graphs, and double line graphs. Students will: Analyze, interpret,
Subjects:
Grades:
6th - 8th
Types:
Also included in: Science Bell Ringers Bundle
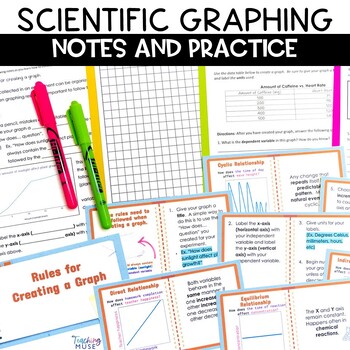
Graphing in Science Activity
Teach your students to create a graph in science, graph independent and dependent variables, and understand graphing relationships using this print and digital activity. This scientific graphing lesson includes a teacher presentation to introduce graphing rules, how to graph variables, and graphing relationships. Students will follow along on their fill in note sheet and complete the practice problems. In addition, there is a graphing assessment to track student progress. Students will learn: Gr
Subjects:
Grades:
6th - 8th
Types:
Scientific Method Worksheet Graphing and Data Analysis Practice (Falcons)
Use this data analysis and graphing worksheet to build GRAPHING and DATA ANALYSIS skills. This worksheet provides a data table about the distances that falcons travel. Students follow directions that lead them through graphing and data analysis skills, including making a line graph and then analyzing it.Instruction is built into the worksheet.Students will practice the following skills in this activity:Setting up line graphs, including choosing intervals, labeling axes, and writing graph titles.
Subjects:
Grades:
6th - 9th
CCSS:
NGSS:
MS-LS2-2
, MS-LS2-1
Scientific Method Worksheet Graphing and Analyzing Data Activity (Hummingbirds)
Build GRAPHING and DATA ANALYSIS skills! This worksheet provides a data table related to hummingbird migration. Students follow directions that lead them through graphing the data and analyzing it. Students will practice the following skills in this activity:Setting up bar graphs, including choosing intervals, labeling axes, and writing graph titles.Generating a bar graph from provided data.Pulling data from their graph.Data analysis that requires using data as evidence to support conclusions.R
Grades:
7th - 10th
CCSS:
NGSS:
MS-LS2-4
, MS-LS2-1
, HS-LS2-1
, HS-LS2-2
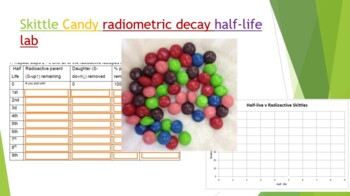
Skittle Radiometric Decay Half-life Lab
Did you know you can use Skittles candy to demonstrate absolute dating and radiometric decay! Buy a 1-4 lb bag at your local bulk warehouse store for savings. This lab is a great way to show how isotopes decay by shaking a plate full of random skittles. Students use Skittles to observe "Isotopes" decay over each half life. At the end of the lab (and only IF they have done all their work) they can enjoy their "daughter products". Skittles were used because they are durable, hypoallergenic, and th
Subjects:
Grades:
8th - 12th, Higher Education, Adult Education
Types:
NGSS:
HS-PS1-8
, HS-PS1-1
, HS-PS1-4
, HS-PS1-6
, MS-PS1-4
...
Also included in: Hands-on Science Semester Labs Bundle
Scientific Method Independent and Dependent Variables Worksheet and Text
Middle school students learn the difference between independent and dependent variables in scientific experiments.This article and questions is also included in our Introduction to Variables Activity.In this activity, students will:Read an article explaining the difference between independent and dependent variablesAnswer basic follow-up check for understanding questions.Teacher Notes:Please note that this resource is not editable.Answer key included.Please consider clicking HERE to follow Eleva
Subjects:
Grades:
6th - 8th
Types:
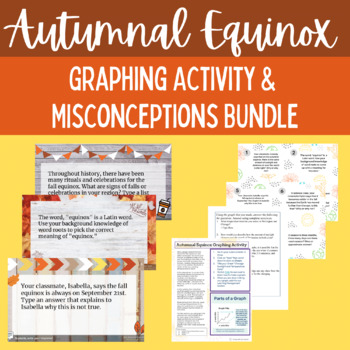
Fall Science Graphing Activity and Misconception Bundle NGSS Earth Science
This resource is perfect for autumn or as part of an Earth Science unit on the earth-sun-moon relationship. Includes an earth science graphing and misconceptions activity for middle school science, a set of printable fall themed discussion cards, and an interactive digital slides activity. Included in this Bundle:The 9-page autumn misconceptions discussion card set includes:2 sets of 16 fall facts and misconceptions discussion topics. The cards are in pdf format and can be cut out and laminated.
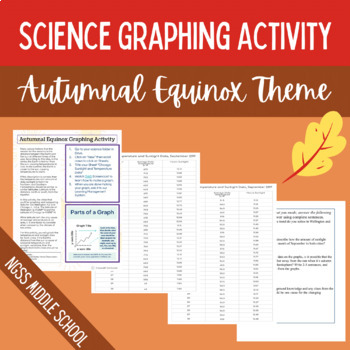
Middle School Earth Science Graphing Activity NGSS Earth Science
Middle school students benefit from practice in analyzing graphs and answering graph-dependent questions. This set includes real sunlight and temperature data in areas approximately equidistant from the equator. Students can use screencast instructions to build a graph that is for Google Sheets.™ Engage your middle school science students with this graphing set with an Earth Science Theme. Included in this cross curricular resource are:Students have many misconceptions about the autumnal equino
Subjects:
Grades:
6th - 8th
Types:
NGSS:
MS-ESS1-1
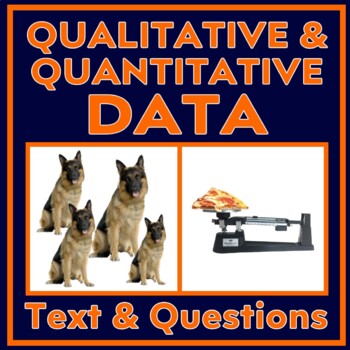
Qualitative and Quantitative Data Informational Text and Worksheet Questions
Middle school students learn the difference between qualitative and qualitative in scientific experiments.This article and questions is also included in our Introductory Data Analysis Activity.In this activity, students will:Read an article explaining the difference between qualitative and quantitative data.Answer basic follow-up check for understanding questions.Teacher Notes:Please note that this resource is not editable.Answer key included.Please consider clicking HERE to follow Elevation Sci
Subjects:
Grades:
6th - 8th
Types:
Introduction to Graphing Lesson with Power Point and Assignment
This presentation includes a lot of the basic terms that students need to build a base for future mathematics courses. These principles are used in geometry, algebra, and trigonometry. I have used this as low as the eighth grade level and collegiate courses.
Key Terms:
Graph
Axes
Ordered Pairs
x-intercept
y-intercept
Distance Formula
This presentation has been left as a pptx file so animations can be added or taken away if they buyer wishes. The preview file is a pdf of the presentation. Both
Subjects:
Grades:
6th - 12th, Higher Education, Adult Education
Argumentative Writing Prompt – Diseases in the Mid-1900s
This is a lesson that combines the basics of argumentative writing (claim-evidence-reasoning) as well as germ theory and the proliferation of vaccines in the 1950s.This lesson is all-encompassing; meaning the student should be able to complete the lesson without referring to outside resources. This could easily be modified to include a more robust research lesson on the spread of disease in America in the 1900s and the increased use of vaccines at the same time.I use this as a digital break for
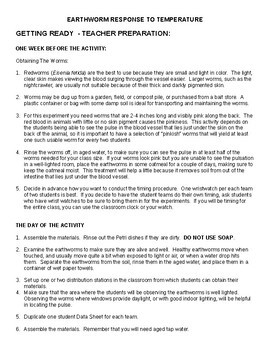
Earthworms Response to Temperature
This is a lab for Middle School and High School Science classes. It uses Red Wigglers, Eisenia fetida, to manipulate temperature variables to affect the worm's pulse rate. Red Wigglers are easy to work with and allow students to see the blow flow through the closed circulatory system and calculate the pulse rate of the worm. This lab uses graphing and data collection to help students understand how science accumulates data to make inferences about how conditions affect animals.
Showing 1-14 of 14 results


