7 results
Common Core 6.SP.A.3 activboard activities
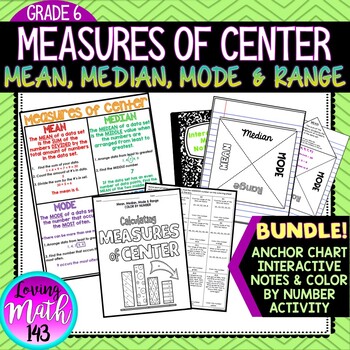
Mean Median Mode and Range Interactive Notes, Poster and Activity BUNDLE
Mean, Median, Mode & Range Color By Number ActivityThis color by number activity is a fun and engaging way for students to practice calculating the measures of center including mean, median, mode and range. Students will solve 16 questions involving mean, median mode, and range then find their answer on the color by number sheet. If their answer is not on the color by number then their answer is not correct. This activity is aligned with the sixth (6th) grade common core standards.WHATS INCL
Subjects:
Grades:
5th - 8th
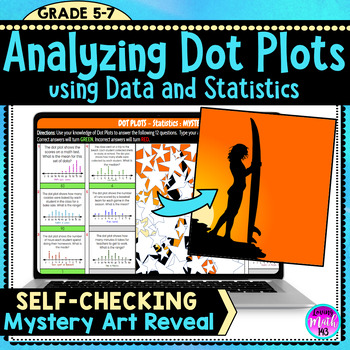
Analyzing Dot Plots using Data and Statistics Fun Digital Mystery Art Reveal
This Digital Self-Checking Math Activity allows middle school students to practice analyzing dot plots using data and statistics. Students will apply their understanding of line plots, mean, median, mode and range. Each correct will reveal part of a fun Mystery Picture! Great resource as independent practice or homework.This is a perfect activity to check for understanding of probability and statistics during distance learning and students using Google Classroom™. You can share this activity wit
Subjects:
Grades:
6th - 7th
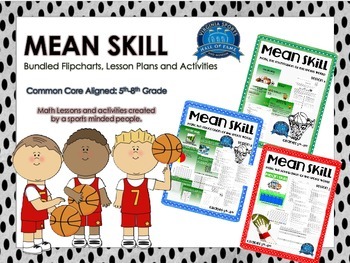
Mean Skill Bundle
This series contains 3 lesson plans that are cumulative. The lesson series covers averages, mean, median, mode, range, percentages, fractions, decimals, graphing and analyzing results. Students start out by learning the importance of stats in sports and how they drive the sports world; from there the students learn the math skills and how to calculate the average scores and the conversion of successes from fractions to decimals and percentages before measuring their own skills and calculating th
Subjects:
Grades:
5th - 8th
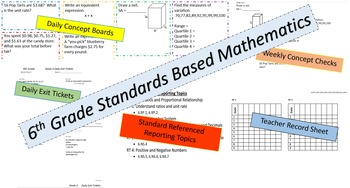
6th CCSS Math Concept Boards (Wk 1-4)
A three-week spiral that covers all the 6th grade Common Core standards.The first week with only one board, instead of four. This allows more training time for both using the board and the concepts involved. There are also daily exit tickets and a Friday Concept Check to be used on the fifth day as an assessment. The review slide is designed to review any difficult concepts from the previous week's Concept Check. The CCSS for each problem is labeled on the boards, exit tickets, and weekly asses
Subjects:
Grades:
6th
Mean Skill Lesson 3
Mean Skill – for 5th-8th grade. This is the third and final lesson in the lesson series. Each lesson builds upon the last, and this final installment focuses on mean, median, mode, range, graphing and analyzing. Students test their own skills in a series of trials and use that data just like athletes would to make predictions based on averages then compare players using graphs. This final lesson wraps up the message and mission of showing your students how math learned in class is used in the
Subjects:
Grades:
5th - 8th
Mean Skill
Mean Skill – for 5th-8th grade. This is the first lesson of a 3 lesson bundle that are cumulative. This lesson series covers percentages, fractions, and decimals. Students start out by learning the importance of stats in sports and how they drive the sports world; from there the students learn the math skills and how to calculate the average scores and the conversion of successes from fractions to decimals and percentages before measuring their own skills and calculating their individual success
Subjects:
Grades:
5th - 8th
Types:
Mean Skill Lesson 2
Mean Skill – for 5th-8th grade. This is the second lesson of a 3 lesson bundle that are cumulative. This lesson series covers graphs from coordinate grids to histograms and pie charts. Students use their data from lesson one the same way an athlete would use their performance stats by graphing and analyzing their scores. Showing your students how math is used in the real world and in a popular and likable past-time like sports. Lesson two reviews the must haves when creating a graph, reading dif
Showing 1-7 of 7 results

