3,668 results
Graphing independent work microsofts
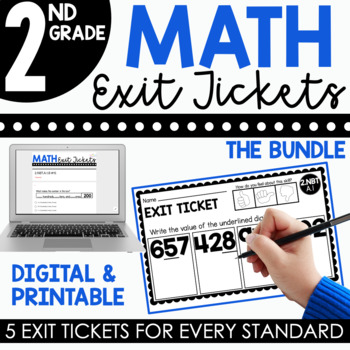
2nd Grade Math Exit Tickets (Exit Slips) Bundle | Printable & Digital Included
UPDATE: This resource now includes digital exit tickets on Google Forms(TM). They can be assigned on any online platform and are auto-graded!Exit Tickets are a great tool to quickly assess your students' understanding of a concept. Exit tickets should take no longer than a couple of minutes to complete and they provide the teacher with valuable information to help guide their instruction.Please download the preview file above for a closer look at what's included!This set of exit tickets cover A
Subjects:
Grades:
2nd
Types:
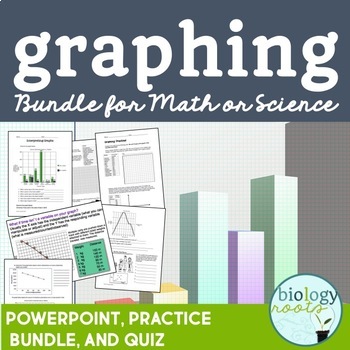
Graphing Bundle for Secondary
Complete and editable graphing bundle includes plenty of practice, editable PowerPoint notes to introduce or reinforce graphing concepts, as well as an assessment to finish it off! Suitable for grades 7 and up. Included in the package is:1. How to Interpret Graphs PowerPoint PresentationCovers line graphs, bar graphs, scatter plots and pie charts. Answers included on teacher version.Student notes included (PDF and PPT). 2. Interpreting Graphs- 3 pages of graph interpretation in which students an
Subjects:
Grades:
6th - 10th
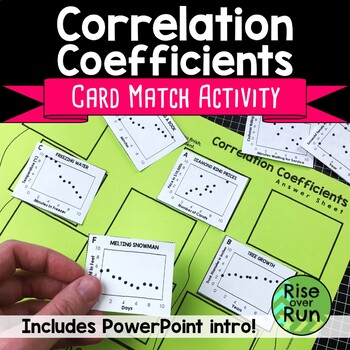
Correlation Coefficients for Scatter Plots Card Sort Practice Activity
Need an engaging lesson to help students understand correlation coefficients? In this PowerPoint and card sort activity, students interpret scatter plots and association patterns to determine correlation coefficients.Here's what is included:Intro PowerPoint: Get students thinking about association as they discover what a correlation coefficient means. The slideshow has several examples of scatter plots for students to compare and contrast. Correlation coefficients are given so students can figur
Grades:
9th
CCSS:
Also included in: Algebra 1 Discovery Lessons and Inquiry Activities Bundle

Beaker Pong: Experimental Design and Graphing Lab, NGSS aligned
Great 1st week or 1st month STEM activity! All parts are EDITABLE and includes a graphing grid! This is a great way to introduce the "science process" (better phrase for scientific method) at the start of a semester or anytime you want fun to occur in your classroom.*****Focus on the NGSS PRACTICES Dimension*****The National Research Council's (NRC) Framework describes a vision of what it means to be proficient in science; it rests on a view of science as both a body of knowledge and an evidenc
Subjects:
Grades:
7th - 12th
Types:
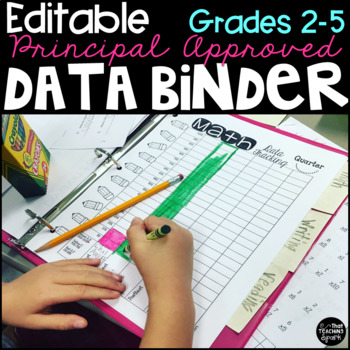
Editable Student Data Tracking Binder Grades 2-5
Ready to watch your students' score skyrocket? Allow them to start tracking their own data! Have your kiddos record their pretests, set goals, learn, and then watch as their post test scores blow you away! Perfect for educators who are evaluated using the Marzano Evaluation Model. This file is editable!
Download the preview to see all the magic included!
This Data Binder includes...
Every page below (except math facts) includes a NONeditable AND an EDITABLE version!
Girl Binder Cover
Boy
Grades:
2nd - 5th
Types:
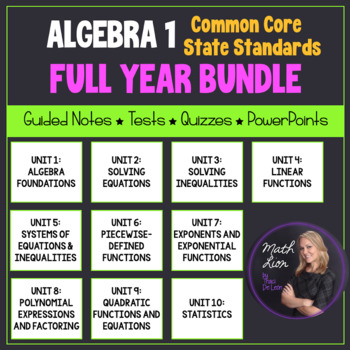
Algebra 1 Curriculum - Full Year EDITABLE Unit Plans | Bundled for Common Core
This is a great bundle that covers concepts for a full year Algebra 1 course! 76 lessons are included! Documents are EDITABLE!Included:- Overview of the common core alignment tandards (Two 18-week guides) (PDF and Word) - Overview of the common core alignment (PDF)- Guided notes for 76 lessons (PDF and Word)- PowerPoint presentations (aligned with guided notes) (PPTX)-10 Mid-unit quizzes (PDF and Word)-10 Unit tests (PDF and Word)-2 Semester exams (PDF and Word)Each lesson contains a learning
Grades:
8th - 12th
CCSS:
Graph Points on the Coordinate Plane (Mini Bundle) - Distance Learning
This is an awesome bundled lesson that will have your kids accurately graphing points on the coordinate plane in no time.Included in this bundled unit:PowerPointThe entertaining, interactive, and easy-to-understand 17-slide PowerPoint walks learners through:-The development of the coordinate plane-Basic graphing and coordinate plane terminology: x-axis, y-axis, ordered pair, coordinates, origin, quadrant, etc.-Plotting point demonstrations-Various plotting point practice (three slides)These embe
Subjects:
Grades:
5th - 6th
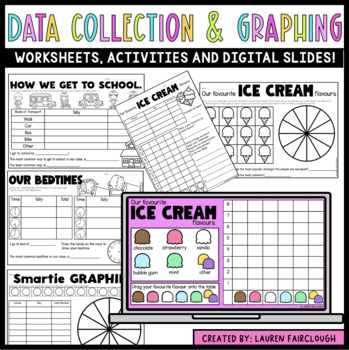
Data Collection and Graphing
Your students are going to LOVE learning all about Data Collection and Graphing with this FUN, HANDS ON pack! 10 topics are included and each includes a variety of worksheets and activities for students to collect and display data!A digital PowerPoint presentation with a number of interactive digital data collection tables and displays is also included! Please see the preview for a closer look at what is included! There are AU and US spelling versions included.
Grades:
K - 3rd
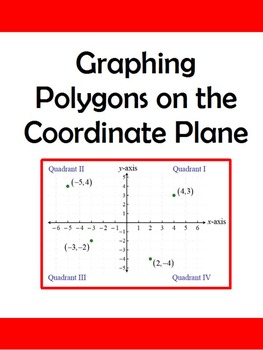
Graphing Polygons on the Coordinate Plane to Find Area/Perimeter
This activity asks the students to plot various ordered pairs on a coordinate plane and connect the points to make a polygon. Then they are expected to calculate the area and/or perimeter of each shape. The first worksheet has a square, two rectangles and a triangle. The triangle is starred to show higher level thinking. Each polygon is to be colored a different color. The second worksheet asks the students to plot the points of five polygons: a triangle, two rectangles and two composite f
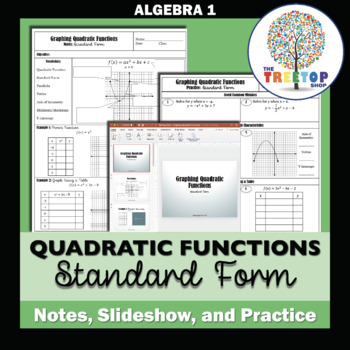
Graphing Quadratic Functions (Standard Form) - Notes, Slideshow, and Practice
Students will:-Identify key features of graphs of quadratic functions.-Graph quadratic functions in standard form using a table of values.-Graph quadratic functions from standard form by finding the axis of symmetry, vertex, and y-intercept.Includes everything you need to teach this lesson in one folder:-PDF of guided notes (with key)-Editable PowerPoint and Google Slide presentation for use with guided notes-PDF of practice problems (with key)Copy the guided notes for students and present the l
Subjects:
Grades:
9th - 12th
CCSS:
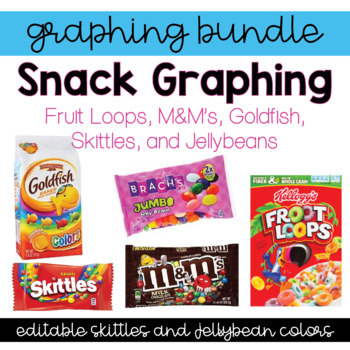
Graphing Bundle! M&M's, Skittles, Fruit Loops, Goldfish, Jellybeans!
This graphing bundle will help make teaching graphing a lot more delicious!
This bundle includes sorting pages and graphing/recording pages for the following snacks:
M&M’s, Fruit Loops, Skittles, Colorful Goldfish, and jellybeans!
I have included 5 and 6 color jellybean options that are editable. Select the page with either 5 or 6 beans and then click on the textbox that says “color” on the pages to enter the jellybean colors that your class will be graphing.
Also included is a cla
Grades:
PreK - 1st
Types:
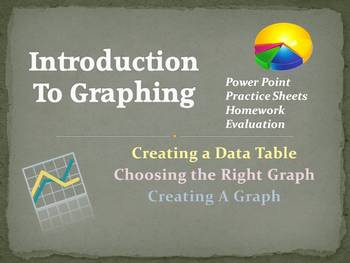
Data Tables and Graphing Introduction and Practice
Students need practice creating data tables and graphs. Students also need to be able to interpret existing graphs. This lesson introduces students to data tables and graphs, teaches students how to create data tables from data, how to interpret tables and graphs, and offers hands-on opportunities to create data tables and graphs.
A 29-slide Power point presentation introduces data tables and graphing skills, offered in both 2003 and 2007 versions of Power point. Accompanying work pages in P
Subjects:
Grades:
5th - 8th
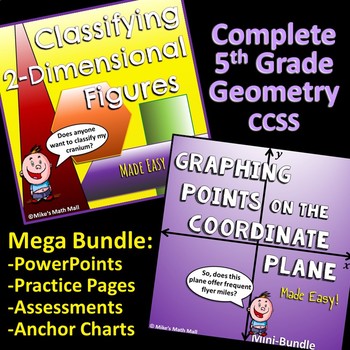
5th Grade Geometry - Complete CCSS - (Bundled Unit)
This is an awesome bundled unit that COMPLETELY covers the entire CCSS for 5th grade geometry.Resources included in this mega-bundle: PowerPoint - Graphing Points on the Coordinate PlainThe entertaining, interactive, and easy-to-understand 17-slide PowerPoint walks learners through:-The development of the coordinate plane-Basic graphing and coordinate plane terminology: x-axis, y-axis, ordered pair, coordinates, origin, quadrant, etc.-Plotting point demonstrations-Various plotting points practic
Grades:
4th - 6th
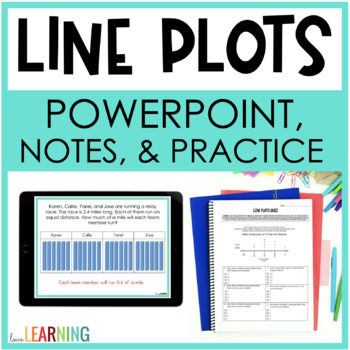
Line Plots with Fractions Slides Lesson with Notes and Google Slides™ Worksheets
These line plots with fractions bundle includes a lesson, notes, and worksheets are perfect for your 5th grade math classroom! Students will learn how to read a line plot, display data on a line plot, and redistribute data on a line plot using guided math practice and real-world math examples.I have also included teacher notes and some editable slides in the PowerPoint to make this fit your math classroom whether you teach math workshop, guided math, or use math centers.Students will learn:The d
Subjects:
Grades:
5th
CCSS:
Also included in: 5th Grade Math Bundle for the ENTIRE YEAR!
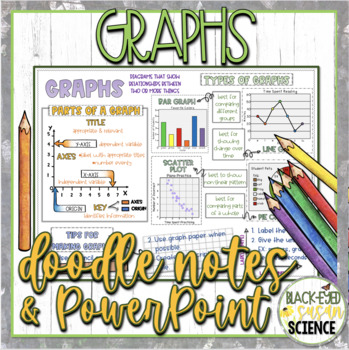
Graphs Doodle Notes & Quiz + Power Point
-DIFFERENTIATED CONCEPT NOTES -QUIZ -ANSWER KEYS -RIGOROUSDo your students love to doodle while taking notes? Don't fight it, embrace it with Doodle Notes (aka Squiggle Sheets)!!!These notes are not only fun but help students to meet Next Generation Science Standards.Notes are differentiated. 3 versions are included. Use the included answer key or choose to use the blank version to make the notes your own.Some things covered in these notes:parts of graphstipstypes of graphsbarlinecirclescatter
Grades:
6th - 8th
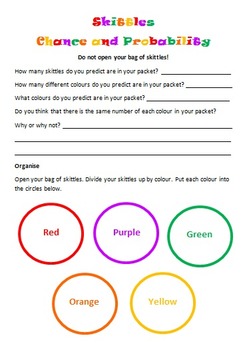
Skittles Chance and Probability (Editable)
Chance and Probability activity using yummy Skittles!!!
Students are to predict the colours and quantities before they open the skittles bag. Students are to complete a chance experiment where they use a tally to collect their data. Students then transfer their data in fractions, decimals and percentages. Students are to create a bar graph using their data as well as answer chance and probability questions about the data. I used this with my grade 5/6 students and they loved it!
Subjects:
Grades:
3rd - 10th
Types:
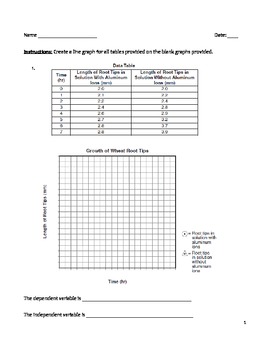
High School Science Graphing Worksheet - Making Line Graphs in Science
Use this worksheet to help your students practice making line graphs. In addition, they will have to identify both the independent and dependent variables. Hopefully, they will make the connection between the variables and their placement on the graph. There is a key provided for the teacher. There are ten line graphs for students to work with.
line graph, plot points, independent variable, dependent variable, data table, uniform scale, x-axis, y-axis
Subjects:
Grades:
8th - 12th
Types:
Coordinate Plane Amusement Park Project
This 11-page project packet is designed for students to create a "blue print" of their own amusement park. Packet also includes 3 pages of teacher directions/tips and a checklist. This is a culminating unit project to be used at the end of a unit on integers/graphing in the coordinate plane. By following the steps in each of five tasks, students create an amusement park using all four quadrants of the coordinate plane. Students demonstrate understanding of plotting points on the coordinate pl
Grades:
6th - 7th
Types:
3rd and 4th Grade Multi-Step Word Problems-(200 Problems)
This packet includes over 200 word problems working on these skills:• 2 and 3 digit addition/subtraction • Carrying/Borrowing• Multi-steps• Graphing skills-Pictographs, Bar Graphs, Line Graphs, & Pie Graphs • Language-“Dozen, Half, Twice” and other key vocabulary for word problems• Other sheets that include problem solving skills• Lining up decimals using money• Place value• Multiplication/Division concepts and basic understandingThis is a PDF that includes a little over 200 multi-step word
Subjects:
Grades:
3rd - 5th
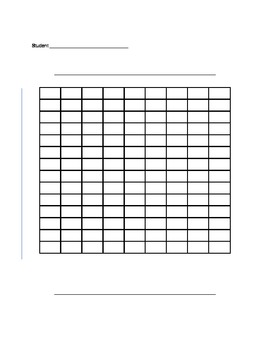
Blank Bar Graph/Double Bar Graph Template
This is a bar graph template that can be used by teachers to teach students how to understand bar graphs and create their own bar graphs. Teachers can use this template teach students about parts of a bar graph and how to interpret data in bar graphs.
Grades:
1st - 12th
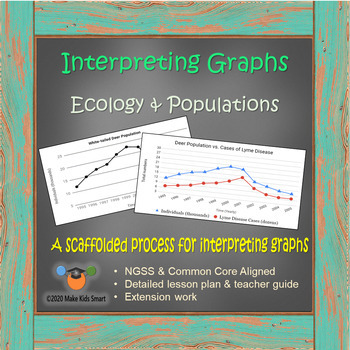
Interpreting Graphs - Ecology & Populations (17 slide Distance Learning Packet)
Teach students how to analyze and interpret line graphs, describe trends, and discuss data using a proven 5-step process. This is 2-3 periods of work suitable for distance learning and meant to move gradually from teacher led to independent work.All materials are found within this 17 page editable power point which is suitable for distance learning. Slides can be shared individually for student completion or shared as a full packet.Please check the preview to see exactly what you are downloading
Subjects:
Grades:
6th - 12th
NGSS:
HS-LS2-7
, MS-LS2-2
, MS-LS2-5
, HS-ESS3-2
, MS-LS2-4
...
NGSS Intro to Graphing Crosscutting Concepts Science & Engineering Practices
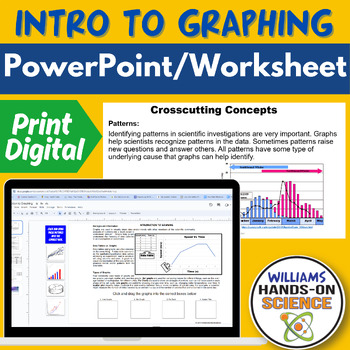
If you are teaching your students how to understand graphs and want to hit NGSS Science and Engineering Practices and Crosscutting Concepts, this resource is a great scaffold or lecture! This resource is great as a warm up/bell ringer, lecture, homework or sub plan.This resource includes the following:-Student Handout-Key-Editable PowerPoint for lecture and/or scaffold This resource includes the following Concepts:-Interpreting Graphs-How to make a graph-Difference between data tables and graph
Subjects:
Grades:
6th - 12th
Scientific Method Variables and Graphing Practice
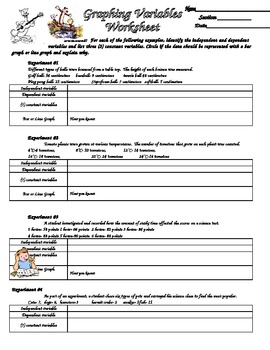
Students are given six different sets of experimental data and asked to identify the variables (independent, dependent etc.). They also reinforce graphing by identifying if the data should be represented with a bar or line graph. With this information, students the create data tables and graphs for the data.
Subjects:
Grades:
3rd - 12th
Types:
Reflecting Points and Shapes over the Axes
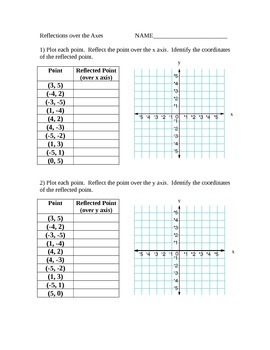
This worksheet gives students an opportunity to practice reflecting points and shapes over the x and y axis. Students explore that a reflection has on the impact on x and y values of a point. There are 20 problems on reflecting points and 4 problems on reflecting triangles.
Grades:
5th - 7th
Types:
Showing 1-24 of 3,668 results


