3 results
Elementary place value graphic organizers on sale

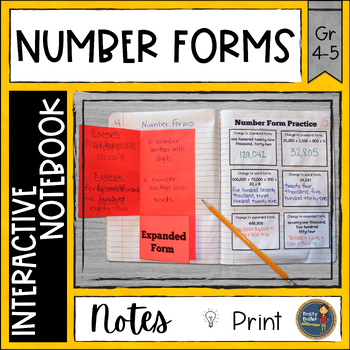
Number Forms Interactive Notebook
This interactive notebook on number forms is perfect for your students' math notebooks. Your students can work on understanding what each form means and examples of each. Number Forms Interactive Notebook includes:✓ a foldable sheet for note taking✓ a practice sheet✓ example answer keys There are 2 versions with version including unit form.Skills included on Version 1:✓ standard form✓ word form✓ expanded form✓ numbers on practice sheet include numbers below 1 millionSkills included on Version
Subjects:
Grades:
4th - 5th
CCSS:

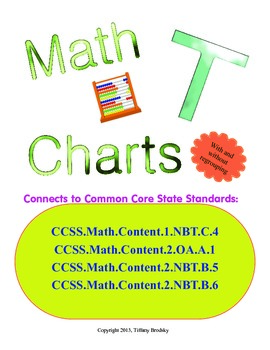
Math T Charts for Addition & Subtraction w/ Place Values & w/ & w/o Regrouping
Math T Charts are an excellent and easily applied resource to help students with practicing addition and subtraction for places ones, tens, and/or hundreds. During the first few uses, it is suggested to explain why it is a T chart. This is a T Chart because it is an upside down capital T. Later, students may be encouraged to draw their own T charts if they still need them.What's included:Addition T ChartsSubtraction T ChartsYour Choice T Charts (no operation signs are written on these)Ones an
Subjects:
Grades:
1st - 2nd

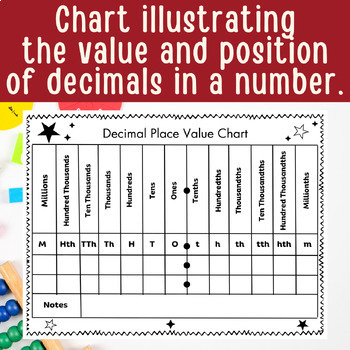
Place Value Chart Poster with Decimals | Fractions Math Worksheet Activities
The chart provided is an exceptional aid for children to comprehend the concepts of place value, decimals, and their correlations. Additionally, it contains the spelled-out unit names and their corresponding mathematical abbreviations, which helps children get accustomed to important mathematical terminology. The chart is categorized into place values, starting from millions and descending to millionths, with a decimal point at the midpoint. Beneath each category, there are unfilled boxes for ch
Subjects:
Grades:
2nd - 6th
Showing 1-3 of 3 results


