8 results
Elementary measurement graphic organizer interactive whiteboards
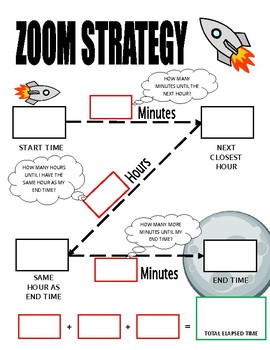
Elapsed Time Worksheets and Template
This bundle includes three elapsed time worksheets that are differentiated to three different levels. Sheet 1 is the simplest and allows students to mainly focus on coming up with the elapsed time and only goes to the nearest 15 minute (i.e. 11:45). Sheet two is slightly more complex in that students need to tell the time on more analog clocks and it goes mainly to the nearest 5 minutes (i.e. 11:10) and only one question going to the nearest minute. Sheet three is the most difficult and requires
Subjects:
Grades:
3rd
CCSS:
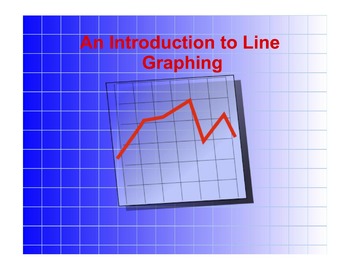
Introduction to Line Graphing (A Smartboard Presentation for 3rd - 5th Grade)
Graphs are terrific organizers! They can present information in a useful, accessible way. However there are so many things to remember when setting up a graph.
This Smartboard presentation goes through the basics of setting up a line graph, starting with the x and y axis, how to organize the information on each axis, how to plot points, and label information on a graph. This is a great introduction that touches on all of the basics of graph organization and set up.
Subjects:
Grades:
3rd - 5th
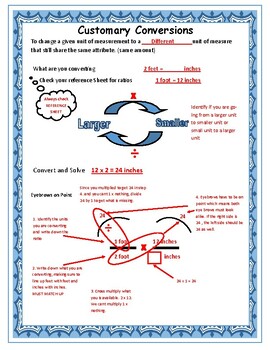
5.7A Customary Conversions
Save time with these digital anchor charts that will help organize your students Interactive notebooks or AVID binders and keep the teacher on pace. There is a teacher copy with notes and explanations in red and a student copy. The teacher can display their blank copy on a smartboard, interactive tv or print to display under and document camera. Students will be able to follow along with their own copy as they take notes in colored pens, pencils and highlighters. These anchor charts/interactive
Subjects:
Grades:
5th
CCSS:
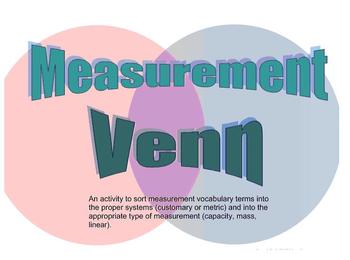
Measurement Venn
Hand-on activity sorting measurement vocabulary words. Students will sort words according to the measurement system (customary or metric) and whether the words are capacity, mass, or linear measurement terms. Students will first sort cards onto mats. Then, as a class, they can check their answers from the Smartboard activity. The Smartboard activity can also be used alone with the whole class, or by pairs of students in a center.
Subjects:
Grades:
3rd - 5th
Second Grade Measurement Resource Pack (EDITABLE!, Standards Aligned)
Are you looking for a set of FULLY EDITABLE resources to supplement your Second Grade Measurement unit? Then this pack is for you! (Or you can purchase the entire second grade resource bundle at Paw-some Resources.)***Please note: Most, not all, pages are EDITABLE. EDITABLE word documents do not contain graphics due to the fact they are editable. Each editable page is an individual word document so you can edit them to fit your and your students' needs. Individual Smart Board lessons are editabl
Subjects:
Grades:
2nd
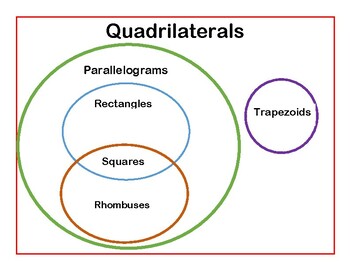
Liquid Measurements, Fractions on a ruler, 2D shapes
In this zip file you'll have three great resources!*A Powerpoint of a ruler broken into eighths and fourths and halves.*A "gallon man" showing equivalent liquid measurements for cups, pints, quarts, gallons.*A venn diagram to show the relationship of quadrilaterals. All are editable and are able to be used on a smart or touch boards to reveal fractions, or draw in shapes.
Subjects:
Grades:
3rd - 4th

Measurement Tree Map
This is a tree map for students that goes over the basics of measuring distance, mass, time, temperature and volume.
Subjects:
Grades:
5th - 6th
Smart Board Calendar Page: Even/Odd Numbers and Days of School
This page is one of the pages used in a daily calendar time. This page features animated clip art with a winter theme. It supports students as they learn about what makes a number even or odd by graphing a randomly generated number (up to 20). It also helps children visualize place value as they count up to the 100th day of school and beyond by offering a digital version of the straw pocket charts used for place value counting.
Subjects:
Grades:
PreK - 5th
Showing 1-8 of 8 results


